Fact-checked by the Prime Rate editorial team
Quick Answer
The prime rate during the 2008 financial crisis fell from 7.25% in September 2007 to a historic low of 3.25% by December 2008, a drop of 4 full percentage points in just 15 months. The Federal Reserve cut the federal funds rate to near zero in response to the worst financial collapse since the Great Depression, pulling the prime rate down with it.
Understanding the prime rate 2008 financial crisis timeline is essential for anyone studying how central bank policy responds to economic emergencies. Tracking at 7.50% as of early 2026, the prime rate has a long way to fall before it revisits crisis-era lows, but historians and economists continue to study the Fed’s 2007–2009 rate-cutting cycle as the definitive modern playbook for crisis management. Tracking 3 percentage points above the federal funds rate, the prime rate was slashed repeatedly as the subprime mortgage collapse spread into a full-blown global financial crisis. According to the Federal Reserve’s historical Open Market Committee records, ten separate rate cuts occurred between September 2007 and December 2008.
That history matters now because the 2008 crisis set a precedent for how the Fed uses interest rates as an emergency lever. The COVID-19 rate cuts of 2020 followed nearly the same playbook, and understanding the 2008 pattern helps borrowers anticipate how rates move during recessions. Knowing what happens to your savings when the prime rate rises or falls starts with studying the most dramatic rate cycle in modern history.
This guide is for students of personal finance, borrowers with variable-rate loans, and anyone trying to understand how the prime rate behaves during a financial crisis. By the end, you will be able to trace every rate change from 2007 through 2009, understand why each cut happened, and apply those lessons to your own financial planning.
Key Takeaways
- The prime rate fell from 8.25% in June 2006 to 3.25% in December 2008, a decline of 5 full percentage points over 30 months, according to Federal Reserve H.15 historical data.
- The Federal Open Market Committee (FOMC) cut the federal funds rate 10 separate times between September 2007 and December 2008, directly driving the prime rate lower at each meeting.
- By December 2008, the federal funds rate reached a target range of 0%–0.25%, the first time in U.S. history it had been set at the zero lower bound, per FOMC historical archives.
- U.S. GDP contracted by 4.3% from peak to trough during the 2007–2009 recession, the steepest decline since World War II, according to Bureau of Economic Analysis GDP data.
- The unemployment rate peaked at 10.0% in October 2009, four months after the recession officially ended, based on Bureau of Labor Statistics historical unemployment records.
- At its crisis-era floor of 3.25%, the prime rate held unchanged for nearly 7 years, from December 2008 to December 2015, the longest such period in modern U.S. monetary history.
In This Guide
- What was the prime rate before the 2008 financial crisis started?
- When did the Fed start cutting rates and why?
- What is the full timeline of prime rate cuts during the 2008 crisis?
- How did the prime rate cuts affect borrowers and credit cards during the crisis?
- How long did the prime rate stay low after the 2008 financial crisis?
- What can the 2008 prime rate history teach you about managing money during a crisis?
- Frequently Asked Questions
Step 1: What Was the Prime Rate Before the 2008 Financial Crisis Started?
Before the crisis hit, the prime rate was significantly elevated, sitting at 8.25% in the summer of 2006. That level reflected a period of aggressive Fed tightening designed to cool inflation and a red-hot housing market. To understand the magnitude of what happened during the prime rate 2008 financial crisis, you first need to see where rates started.
The Pre-Crisis Rate Environment
From June 2004 to June 2006, the Federal Reserve raised the federal funds rate in 17 consecutive steps of 0.25 percentage points each, pushing it from 1.00% to 5.25%. That drove the prime rate from 4.00% to 8.25% over the same period, as tracked by the Federal Reserve’s H.15 Selected Interest Rates release.
Rate hikes paused from June 2006 through September 2007, holding the prime rate steady at 8.25% for 15 months. During that pause, the subprime mortgage market was quietly unraveling beneath the surface.
What to Watch Out For
A common misconception is that the financial crisis started in 2008. It did not. Cracks began appearing in mid-2007: Bear Stearns liquidated two subprime hedge funds in July 2007, and the BNP Paribas fund freeze in August 2007 signaled the credit crisis had gone global. By September 2007, the Fed was already cutting rates for the first time in four years.
The prime rate is not set by a government committee, it is set by individual banks. However, it moves in lockstep with the federal funds rate, almost always sitting exactly 3 percentage points above the Fed’s target rate. This relationship has held consistently since the 1990s.
Step 2: When Did the Fed Start Cutting Rates and Why?
On September 18, 2007, the Federal Reserve made its first emergency rate cut, officially beginning the prime rate 2008 financial crisis response cycle. The move was larger than markets expected: the FOMC reduced the federal funds rate by 0.50 percentage points, bringing the prime rate down from 8.25% to 7.75% overnight.
The Trigger Events
Three major stress events forced the Fed’s hand in the fall of 2007. First, the collapse of the subprime mortgage market caused delinquency rates to surge, subprime mortgage delinquencies exceeded 20% by late 2007, according to the Federal Reserve’s research on the subprime crisis. Second, interbank lending rates spiked as banks refused to lend to each other. Third, the seizure of credit markets threatened to choke off lending to American businesses and consumers.
Fed Chairman Ben Bernanke, an academic expert on the Great Depression, recognized these signals as systemic rather than cyclical. His response was decisive and aggressive by historical standards.
In congressional testimony and public remarks throughout 2008, Bernanke stated that the Federal Reserve would use all available tools to prevent the kind of financial system collapse that deepened the 1930s Depression, and that maintaining the flow of credit to sound borrowers was a central priority. Those statements are part of the public record in FOMC historical archives.
What to Watch Out For
Rate cuts do not immediately stimulate the economy. There is typically a 6–18 month lag before monetary policy changes filter through to real economic activity. Cutting in September 2007 was never going to prevent the crisis from deepening; the goal was to buy time and reduce the severity of the eventual downturn.
The S&P 500 fell 56.8% from its peak of 1,565 in October 2007 to its trough of 676 in March 2009, one of the worst equity bear markets in U.S. history. Rate cuts alone could not stop the market’s collapse.
Step 3: What Is the Full Timeline of Prime Rate Cuts During the 2008 Crisis?
The complete prime rate 2008 financial crisis timeline spans 15 months and includes ten separate rate reductions, starting in September 2007 and ending in December 2008. Each cut was a direct response to worsening economic and financial conditions.
The Complete Rate-Cut Chronology
Below is every Federal Reserve rate action during the crisis period, along with the corresponding prime rate at each step. All data is sourced from the FOMC historical meeting records.
| Date of Cut | Fed Funds Rate Cut | New Federal Funds Rate | Resulting Prime Rate |
|---|---|---|---|
| Sept 18, 2007 | -0.50% | 4.75% | 7.75% |
| Oct 31, 2007 | -0.25% | 4.50% | 7.50% |
| Dec 11, 2007 | -0.25% | 4.25% | 7.25% |
| Jan 22, 2008 | -0.75% | 3.50% | 6.50% |
| Jan 30, 2008 | -0.50% | 3.00% | 6.00% |
| Mar 18, 2008 | -0.75% | 2.25% | 5.25% |
| Apr 30, 2008 | -0.25% | 2.00% | 5.00% |
| Oct 8, 2008 | -0.50% | 1.50% | 4.50% |
| Oct 29, 2008 | -0.50% | 1.00% | 4.00% |
| Dec 16, 2008 | -0.75%–1.00% | 0.00%–0.25% | 3.25% |
Notice the gap between April and October 2008. Rate cuts actually paused for five months as commodity prices surged and inflation concerns temporarily took priority. Then Lehman Brothers collapsed on September 15, 2008, sending shockwaves through global markets and forcing the Fed back into emergency-cut mode.
The Lehman Moment
October and December 2008 were qualitatively different from the earlier cuts. The September 2008 bankruptcy of Lehman Brothers Holdings Inc., at the time the largest bankruptcy filing in U.S. history, with $639 billion in assets, caused a complete seizure of global credit markets. The Reserve Primary Fund, a money market fund, “broke the buck” the next day, triggering a run on money market funds nationwide.
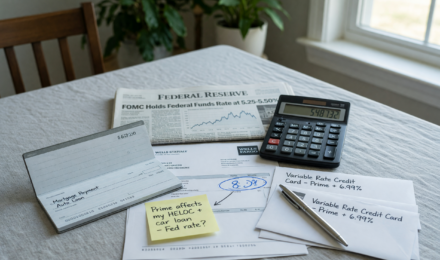
Do not confuse the federal funds rate with the prime rate. The federal funds rate is set by the FOMC and represents what banks charge each other for overnight lending. The prime rate is what banks charge their most creditworthy commercial customers. The prime rate is always the federal funds rate plus 3 percentage points, but your credit card or home equity line of credit rate is often the prime rate plus an additional margin based on your creditworthiness.
Step 4: How Did the Prime Rate Cuts Affect Borrowers and Credit Cards During the Crisis?
When rates fell from 8.25% to 3.25%, the impact on variable-rate borrowers was dramatic, but the benefits were unevenly distributed. Borrowers with existing variable-rate products saw their rates fall, while new credit applicants often found lending standards had tightened sharply.
Who Benefited From Lower Rates
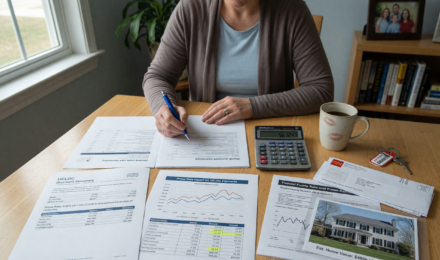
Homeowners with adjustable-rate mortgages (ARMs) and home equity lines of credit (HELOCs) tied to the prime rate saw immediate payment reductions. A HELOC balance of $50,000 at prime plus 1% would have seen its rate fall from 9.25% to 4.25%, reducing the monthly interest cost by roughly $208 per month on an interest-only basis.
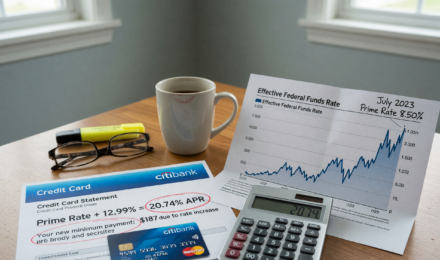
Credit card holders with variable-rate cards also saw rates drop, though banks began adding higher risk margins and cutting credit limits during this period. Understanding how the prime rate affects your credit card interest rates is crucial for anyone carrying a balance, since the prime rate is the foundation of most variable APRs.
The Credit Crunch Paradox
A genuine paradox emerged from the rate cuts: rates were falling, but access to credit was shrinking. Banks tightened lending standards aggressively. The Federal Reserve’s Senior Loan Officer Opinion Survey from late 2008 showed that more than 80% of U.S. banks had tightened standards for commercial and industrial loans, the highest percentage on record at that time. For borrowers with anything less than pristine credit, the cheaper rate environment was largely theoretical.
Economists describe this as a “credit crunch”, monetary policy can lower the cost of credit, but it cannot compel banks to extend it. Rates fell to generational lows, yet millions of qualified borrowers could not access them. That gap between the rate environment and actual credit availability is a feature of every severe banking crisis, not just 2008. It is also why understanding how the prime rate affects your mortgage and home equity loan matters so much: transmission from Fed policy to your actual borrowing cost depends entirely on your credit profile and the specific product you hold.
If you had a variable-rate loan during the 2008 crisis and your rate did not drop along with the prime rate, it is likely because your loan had a rate floor written into the contract. Always check your loan agreement for a minimum rate clause before assuming your payment will fall when the prime rate does.
Step 5: How Long Did the Prime Rate Stay Low After the 2008 Financial Crisis?
Stuck at its crisis-era floor of 3.25% for exactly seven years, from December 16, 2008 to December 17, 2015, the prime rate sat unchanged longer than at any point in modern U.S. monetary history. That extended plateau reshaped an entire generation’s relationship with borrowing, saving, and investing.
The Zero Lower Bound Era
Holding the federal funds rate at 0%–0.25% was unprecedented. Economists refer to this as the zero lower bound (ZLB): the point at which traditional rate cuts lose their effectiveness because rates cannot go meaningfully below zero without extraordinary measures. With the prime rate stuck at 3.25%, savers earned near-nothing on bank deposits for years. Many turned to stock market investing out of necessity rather than choice, not because stocks had become less risky, but because savings accounts had stopped functioning as income-generating instruments.
To compensate, the Fed deployed quantitative easing (QE), purchasing more than $3.7 trillion in U.S. Treasury bonds and mortgage-backed securities through three separate rounds between 2008 and 2014, according to Federal Reserve balance sheet data. This was monetary policy operating beyond traditional rate tools entirely.
The Path Back to Normal
On December 17, 2015, the FOMC raised the federal funds rate by 0.25%, bringing the prime rate to 3.50%. What followed was a deliberate, slow normalization: one hike in 2016, three in 2017, four in 2018. By December 2018, the prime rate reached 5.50% before the Fed reversed course in 2019 amid trade war concerns.

A saver who kept $10,000 in a traditional savings account earning the national average rate during the 2009–2015 zero-rate era would have earned less than $150 in total interest over six years, a real-terms loss when adjusted for inflation.
Step 6: What Can the 2008 Prime Rate History Teach You About Managing Money During a Crisis?
Five concrete lessons emerge from the prime rate 2008 financial crisis cycle, and they remain actionable today. History does not repeat exactly, but the patterns of rate behavior in a crisis are remarkably consistent.
Lesson 1, Variable-Rate Debt Cuts Both Ways
When rates fall in a crisis, variable-rate loans get cheaper. When rates rise afterward, they get expensive fast. Anyone who took on maximum HELOC debt during the low-rate era of 2009–2015 faced painful payment increases as rates climbed from 3.25% to 8.50% between 2015 and 2023. If you carry variable-rate debt, build a budget buffer that can absorb rate swings of at least 2–3 percentage points. A good resource for structuring that buffer is this guide on how to create a monthly budget that actually works.
Lesson 2, Emergency Funds Are Non-Negotiable
During the 2008 crisis, unemployment doubled from 5.0% in January 2008 to 10.0% in October 2009, per the Bureau of Labor Statistics. Millions of Americans found themselves jobless at exactly the moment credit markets froze and borrowing became nearly impossible. An emergency fund covering 3–6 months of expenses is the single most effective hedge against that scenario.
Lesson 3, Low Rates Punish Savers; Prepare Accordingly
When rates crashed to 3.25% in 2008, high-yield savings accounts that once offered 4%–5% APY fell to near zero. Savers who had not diversified into other instruments, including CDs locked in at higher rates before the crisis, lost years of earning power. Understanding how CD rates compare to high-yield savings before a rate cycle shifts can protect your returns.
Lesson 4, Debt Payoff Accelerates During Low-Rate Periods
When variable-rate debt costs less, every dollar of payment goes further toward principal. Borrowers who aggressively paid down debt during the 2009–2015 low-rate window eliminated obligations that would have cost far more to service when rates rose again. Learning strategies like the debt snowball and avalanche methods positions you to capitalize on exactly this kind of rate environment.
Lesson 5, Watch the Fed, Not the News Cycle
FOMC rate decisions are published and forecasted through the “dot plot,” a quarterly chart of each member’s projected rate path. Watching FOMC meeting minutes and press conferences gives you weeks of advance notice before prime rate changes take effect. Anyone who followed FOMC signals in September 2007 had time to lock in fixed-rate loans before rates fell further and could have positioned savings products accordingly.
What to Watch Out For
Do not assume that a crisis always leads to rate cuts. In 2022, the Fed raised rates aggressively during an economic slowdown because inflation, not recession, was the primary threat. Rates surged from 3.25% in March 2022 to 8.50% by July 2023 in just 16 months. The type of crisis determines the Fed’s response. Low rates are not guaranteed during every economic shock, and assuming they are is one of the costlier mistakes a borrower can make.
Frequently Asked Questions
What was the prime rate in 2008?
Entering 2008 at 7.25%, the prime rate ended the year at 3.25%, a drop of 4 full percentage points in a single calendar year. The rate changed five times during 2008 alone, on January 22, January 30, March 18, April 30, October 8, October 29, and December 16, as the Federal Reserve responded to the escalating financial crisis with successive emergency cuts.
Why did the Fed cut interest rates so aggressively during the 2008 financial crisis?
Aggressive cuts were necessary because the financial system faced a liquidity crisis threatening to collapse the entire banking sector. The failure of Lehman Brothers, the near-failure of Bear Stearns (rescued via JPMorgan Chase in March 2008), and the freeze in interbank lending markets all signaled systemic risk rather than a normal recession. Lower rates were designed to reduce the cost of borrowing, encourage lending, and prevent a deflationary spiral similar to the 1930s Great Depression.
How did the prime rate 2008 financial crisis affect credit card interest rates?
Variable-rate credit card APRs fell in direct proportion to the prime rate decline, but only for existing cardholders with variable-rate accounts. A card priced at prime plus 12% would have dropped from approximately 20.25% to 15.25% between September 2007 and December 2008. Banks simultaneously tightened credit limits and raised penalty rates, so many consumers saw limited net benefit. You can learn more about how the prime rate affects credit card interest rates in our dedicated guide.
What is the difference between the prime rate and the federal funds rate?
The federal funds rate is the rate at which banks lend reserve balances to each other overnight, set by the Federal Open Market Committee. The prime rate is what major U.S. banks charge their most creditworthy commercial borrowers, and it sits exactly 3 percentage points above the federal funds rate. When the FOMC set the federal funds rate at 0%–0.25% in December 2008, the prime rate became 3.25%, calculated as 0.25% (the top of the range) plus 3 percentage points.
Did the 2008 rate cuts actually help the economy recover?
Rate cuts helped prevent a complete financial system collapse but could not prevent the deep recession itself. The Great Recession officially lasted from December 2007 to June 2009, according to the National Bureau of Economic Research, 18 months, the longest post-World War II recession at that time. Economists including Federal Reserve Chair Ben Bernanke credit the aggressive rate cuts and TARP bank bailout with preventing a second Great Depression, while critics argue they inflated asset bubbles that persisted for years afterward.
How does the prime rate during the 2008 crisis compare to what happened during COVID-19?
The COVID-19 rate response in 2020 was faster but covered less ground. Two emergency actions in March 2020 brought rates to near zero, completing in two weeks what took 15 months in 2007–2008. Rates fell from 4.75% to 3.25% in March 2020, the same floor hit in December 2008. The 2008 cycle involved a longer, more gradual descent because the crisis itself unfolded over many months, whereas COVID caused an almost instantaneous economic shock.
How did the prime rate 2008 financial crisis affect mortgage rates?
The effect on mortgages varied by loan type. Adjustable-rate mortgage holders benefited as their rates fell along with the prime rate. However, 30-year fixed mortgage rates did not fall as dramatically, moving from around 6.5% in mid-2008 to approximately 5.0% in early 2009, according to Freddie Mac’s Primary Mortgage Market Survey. The Fed supplemented rate cuts with QE specifically to push long-term mortgage rates lower. Understanding how the prime rate affects your mortgage helps clarify why fixed and variable products responded so differently.
Should I pay off variable-rate debt when the prime rate is falling?
Falling rates reduce the cost of variable-rate debt, which means more of each payment goes to principal, making it an excellent time to accelerate payoff. The opportunity is temporary, however. Rates that fall will eventually rise, increasing the cost of carrying any remaining balance. The financially sound strategy is to make aggressive extra payments while your rate is low, and lock in a fixed-rate refinance if you cannot fully pay off the balance before rates normalize. See our breakdown of how to pay off credit card debt step by step for a practical framework.
What was the prime rate’s all-time high, and how does the 2008 crisis compare?
At its all-time peak, the prime rate reached 21.5% in December 1980 during the Federal Reserve’s battle against double-digit inflation under Chairman Paul Volcker. The 3.25% floor reached during the 2008 crisis was, at the time, the prime rate’s lowest level on record. That gives you the full historical range: from a high of 21.5% to a low of 3.25%, a spread of 18.25 percentage points over three decades.
Why did the prime rate stay low for so long after the 2008 crisis, and what does that mean for borrowers today?
Seven years at 3.25% reflected how severely the crisis had damaged the economy’s capacity to grow. The Fed was unwilling to raise rates until labor markets and inflation showed sustained improvement, which did not happen until late 2015. For borrowers, the lesson is that crisis-era rate floors can last far longer than expected. Anyone who assumed rates would bounce back quickly and took on long-term fixed-rate commitments at pre-crisis levels paid a price for that assumption.
Sources
- Federal Reserve, H.15 Selected Interest Rates: Historical Data
- Federal Reserve, FOMC Historical Meeting Records and Statements
- Federal Reserve, Open Market Operations: Historical Rate Actions
- Bureau of Economic Analysis, Gross Domestic Product Historical Data
- Bureau of Labor Statistics, Historical Unemployment Rate (CPS Table A-1)
- Freddie Mac, Primary Mortgage Market Survey: Historical Rate Data
- Federal Reserve, Balance Sheet Trends: Quantitative Easing History
- National Bureau of Economic Research, Business Cycle Dating Committee: Recession Dates
- Federal Deposit Insurance Corporation, Crisis and Response: An FDIC History
- Federal Reserve, Research Paper: The Subprime Crisis and Its Implications