Fact-checked by the Prime Rate editorial team
Quick Answer
The U.S. prime rate has ranged from a historic low of 3.25% (held from 2009–2015 and again in 2020–2022) to a record high of 21.5% in December 1980. As of July 2025, the prime rate stands at 7.50%. Understanding the historical prime rate chart helps borrowers time major financial decisions, from mortgages to credit cards, around the Federal Reserve’s rate cycle.
Seven decades of American monetary policy are compressed into a single line on any chart of the prime rate, and that line tells you more about how borrowing costs actually move than any forecast ever will. As of July 2025, the prime rate sits at 7.50%, set by major U.S. banks at 3 percentage points above the federal funds rate target established by the Federal Open Market Committee (FOMC). That spread has remained consistent since the 1990s, making the prime rate one of the most predictable benchmarks in personal finance.
Why does this matter right now? After an aggressive hiking cycle that pushed the prime rate from 3.25% in early 2022 to 8.50% by mid-2023, the highest level since 2001, the Fed held its benchmark rate steady through the first half of 2025. Markets are closely watching for rate cuts that could ripple through home equity lines of credit, adjustable-rate mortgages, credit cards, and personal loans. Knowing where rates have been historically helps consumers and investors make smarter borrowing and saving decisions in this environment.
This guide is for anyone who wants to understand how the prime rate has moved across the decades, why it changed, and how those changes affect everyday financial products. By the end, you will know how to read a historical prime rate chart, identify the forces behind major rate movements, and use that knowledge to make better financial decisions today.
Key Takeaways
- The prime rate hit an all-time high of 21.5% in December 1980, driven by Federal Reserve Chairman Paul Volcker’s aggressive anti-inflation campaign.
- The prime rate held at a record low of 3.25% for seven consecutive years (2008–2015), the longest low-rate stretch in modern U.S. history, according to Federal Reserve Economic Data (FRED).
- Between March 2022 and July 2023, the prime rate rose by 525 basis points in just 17 months, one of the fastest tightening cycles on record, per The Wall Street Journal.
- Because the prime rate is tied directly to credit cards, home equity loans, and many personal loans, a 1% increase in the prime rate adds roughly $100 per year in interest for every $10,000 of variable-rate debt carried.
- The prime rate has changed more than 100 times since 1955, reflecting constant recalibration by the Fed in response to inflation, unemployment, and global economic shocks, per FRED historical data.
- At 7.50% as of July 2025, the prime rate is above the 40-year average of approximately 6.5%, meaning borrowers remain in a historically elevated rate environment.
Questions This Guide Answers
- What is the historical prime rate chart and how do I read it?
- How has the prime rate changed over the decades?
- What caused the prime rate to spike to 21% in 1980?
- How does the prime rate affect my credit card and personal loan interest rates?
- When does the Fed typically cut the prime rate and what signals should I watch for?
- How do I use the historical prime rate chart to make better financial decisions?
- Where can I find a current prime rate chart updated in real time?
- Is the prime rate the same as the federal funds rate?
- What will happen to the prime rate in 2025 and 2026?
- How does a rising prime rate affect my savings account?
In This Guide
- What Is the Historical Prime Rate Chart and How Do You Read It?
- How Has the Prime Rate Changed Over the Decades?
- What Caused the Prime Rate to Hit 21% in 1980?
- How Does the Prime Rate Affect My Credit Card and Loan Rates?
- When Does the Fed Typically Cut the Prime Rate?
- How Do I Use the Historical Prime Rate Chart to Make Better Financial Decisions?
- Frequently Asked Questions
Step 1: What Is the Historical Prime Rate Chart and How Do You Read It?
A line graph that plots the U.S. prime lending rate from the 1950s to the present, the historical prime rate chart is best understood as a record of deliberate policy decisions by the Federal Reserve, not a market-driven price like a stock. Every step up or down reflects an FOMC vote, not supply and demand in a trading pit.
How to Read the Chart
The vertical axis shows the prime rate as a percentage. The horizontal axis shows time, usually in months or years. Each step up or down corresponds to an FOMC meeting at which the federal funds rate was raised or lowered. Because the prime rate is mechanically set at 3 percentage points above the federal funds rate, the two charts are nearly identical in shape.
The most important features to identify on a historical prime rate chart are:
- Peaks: The highest points, like the 21.5% peak in December 1980, signal periods of aggressive inflation-fighting.
- Troughs: The lowest points, like 3.25% in 2009 and 2020, signal recessions or crises where the Fed stimulated the economy.
- Plateaus: Long flat stretches indicate the Fed holding rates steady, often during periods of stable growth or uncertainty.
- Steep slopes: Sharp rises or drops reflect emergency responses to inflation surges or financial crises.
The most freely available source for this data is the FRED Prime Rate database maintained by the Federal Reserve Bank of St. Louis, which tracks the rate back to 1955 and updates within days of any Fed decision.
What to Watch Out For
Before 1994, the prime rate was not always set at exactly 3 points above the federal funds rate. Prior to the FOMC’s adoption of its modern transparency practices, banks had more discretion in setting their own prime rates, so different institutions occasionally quoted slightly different numbers. Always use the Wall Street Journal Prime Rate or the FRED series for historical comparisons, as these represent the consensus rate used in loan contracts.
The prime rate published by The Wall Street Journal is the most widely referenced benchmark. It is reported as the base rate posted by at least 70% of the 10 largest U.S. banks, making it the de facto standard for variable-rate loan contracts across the country.
Step 2: How Has the Prime Rate Changed Over the Decades?
Over the past 70 years, borrowing costs in America have followed a dramatic arc, rising from around 3% in the 1950s, peaking at 21.5% in 1980, and then trending generally downward over four decades before the 2022–2023 hiking cycle reversed that trend. Each era reflects distinct economic forces.
Decade-by-Decade Overview
1950s–1960s (The Stable Era): Rates held in the 3% to 6% range for most of this period. Post-World War II economic expansion was steady, inflation was modest, and the Fed kept policy accommodative. The rate first crossed 6% in 1969, reflecting the early stirrings of inflation driven by Vietnam War spending.
1970s (The Inflation Decade): Oil shocks in 1973 and 1979 sent inflation soaring. Rates climbed from roughly 6% in 1970 to 15.75% by the end of 1979. This decade illustrates how external supply shocks, not just Fed policy, can force rates dramatically higher in a short period. Refer to FRED’s historical prime rate data to see this climb clearly.
1980s (The Volcker Shock and Recovery): Rates spiked to an all-time high of 21.5% in December 1980, then fell sharply as inflation was tamed. By 1986, the rate had dropped back to around 7.5%, which is close to where it stands today. The 1980s chart shows the steepest single-decade swing in rate history.
1990s (Goldilocks Growth): Rate fluctuations ran between 6% and 10%, with a notable tightening cycle in 1994–1995 under Fed Chairman Alan Greenspan and a brief emergency cut during the 1998 Long-Term Capital Management crisis. The decade ended with the rate at 8.5% before the dot-com bust forced rapid cuts.
2000s (Two Crises, Two Crashes): Rates fell from 9.5% in 2000 to 4% by 2003 after the dot-com recession, then rose back to 8.25% by 2006, before plunging to 3.25% in December 2008 during the Global Financial Crisis, where the rate would stay for seven years.
2010s (The Long Zero-Rate Era): From December 2008 to December 2015, the prime rate held at an unprecedented 3.25% for 84 consecutive months. The Fed then gradually raised rates through 2018, reaching 5.5%, before cutting again in 2019 and collapsing back to 3.25% in March 2020 at the onset of the COVID-19 pandemic.
2020s (The Fastest Hike on Record): From March 2022 to July 2023, the Fed raised the federal funds rate by 525 basis points, pushing the prime rate from 3.25% to 8.50%, the highest since 2001. Rate cuts began in September 2024, and the prime rate now stands at 7.50% as of July 2025.

Rates have moved an average of 3–4 times per year during active Fed tightening or easing cycles. During the record-setting 2022–2023 hiking cycle, the FOMC moved rates at 11 consecutive meetings, the most consecutive hikes since the 1980s, according to Federal Reserve FOMC records.
| Era | Prime Rate Range | Key Driver | Duration at Peak/Trough |
|---|---|---|---|
| 1950s–1960s | 3.0% – 6.0% | Post-war stable growth | ~20 years near 3%–4% |
| 1970s | 6.0% – 15.75% | Oil shocks, stagflation | Rate doubled in ~9 years |
| 1980s Peak | 15.75% – 21.5% | Volcker anti-inflation policy | 21.5% held for ~1 month |
| 1990s | 6.0% – 10.0% | Greenspan era, dot-com boom | Relatively stable decade |
| 2008–2015 | 3.25% (flat) | Global Financial Crisis recovery | 84 months at floor |
| 2020–2022 | 3.25% (flat) | COVID-19 pandemic stimulus | 25 months at floor |
| 2022–2023 Hike | 3.25% – 8.50% | Post-pandemic inflation surge | 525 bps in 17 months |
| 2025 (Current) | 7.50% | Gradual Fed easing cycle | Rate cut 100 bps from peak |
Step 3: What Caused the Prime Rate to Hit 21% in 1980?
Reaching an all-time high of 21.5% in December 1980, the prime rate got there because Federal Reserve Chairman Paul Volcker made a deliberate, painful choice: crush inflation at any cost, even if it meant triggering a severe recession. Understanding this episode is the most important lesson any rate chart can teach.
The Root Causes
Inflation had been building throughout the 1970s due to multiple compounding factors. The 1973 OPEC oil embargo caused energy prices to quadruple almost overnight. Federal spending on the Vietnam War had already pushed the money supply higher. Then a second oil shock in 1979, following the Iranian Revolution, sent the U.S. Consumer Price Index to 14.8% annual inflation by March 1980, according to U.S. Bureau of Labor Statistics historical CPI data.
Volcker, appointed Fed Chair in August 1979, concluded that only dramatic rate increases could break what economists called the “inflationary psychology” that had become embedded in wage and price negotiations. The federal funds rate was pushed above 20%, dragging the prime rate to 21.5%.
In testimony before Congress in 1979, Volcker was explicit about the cost: he told lawmakers that the average American’s standard of living would have to decline, because the country had grown poorer as a nation and there was no escaping that reality without first bringing inflation under control. It was a rare moment of institutional candor about what tight monetary policy actually requires.
What Happened Next
The Volcker shock worked, but it caused two recessions in quick succession (1980 and 1981–1982), with unemployment reaching 10.8% in November 1982, the highest since the Great Depression. Once inflation broke, dropping from nearly 15% to under 4% by 1983, the Fed rapidly cut rates. By 1984, the prime rate had fallen from 21.5% to roughly 10.5%.
The lesson from this episode is critical: the Fed is willing to cause significant economic pain to restore price stability. Markets that ignore this history often underestimate how far and how fast the central bank will move when inflation becomes entrenched. The 2022–2023 hiking cycle echoed this pattern on a smaller scale.
What to Watch Out For
Many borrowers in the late 1970s locked into adjustable-rate mortgages assuming rates would stay moderate, then faced devastating payment increases as the prime rate surged. Anyone carrying variable-rate debt should treat the 1980 peak as a reminder that rates can move far higher than they seem “possible” at any given moment.
Adjustable-rate loans, including many HELOCs and credit cards, reset their interest rate based on the prime rate with little warning. When the prime rate moved from 11.5% to 21.5% between 1979 and 1980, borrowers with variable-rate debt saw monthly payments nearly double in under 18 months. Always model your variable-rate loan payments at rates 2–3% above today’s prime rate before signing.
Step 4: How Does the Prime Rate Affect My Credit Card and Loan Rates?
Most variable-rate consumer financial products, including credit cards, home equity lines of credit (HELOCs), adjustable-rate mortgages, and many personal loans, are priced directly off the prime rate. Your actual rate is almost always the prime rate plus a fixed margin, called a spread, set by your lender.
How the Math Works
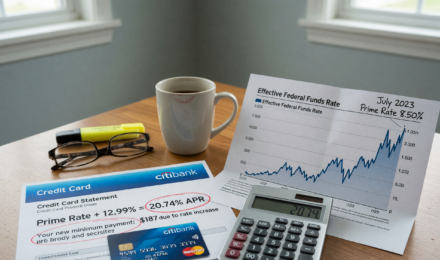
If your credit card agreement states a rate of “Prime + 16.99%,” and the current prime rate is 7.50%, your APR is 24.49%. When the Fed cuts rates by 25 basis points and the prime rate drops to 7.25%, your APR automatically becomes 24.24%. The impact on your minimum payment or total interest cost depends on your balance.
Here is how the prime rate feeds into specific products:
- Credit cards: Almost all variable-rate credit cards use the prime rate as their index. A rising prime rate directly raises your credit card APR within one to two billing cycles.
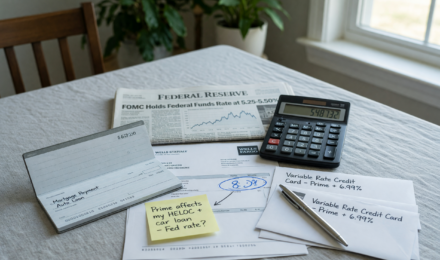
- HELOCs: Home equity lines of credit typically reset monthly at prime rate plus a margin, usually 0% to 2% above prime for well-qualified borrowers. As the prime rate climbed from 3.25% to 8.50% between 2022 and 2023, HELOC payments surged for millions of homeowners.
- Adjustable-rate mortgages (ARMs): Many ARMs use SOFR (Secured Overnight Financing Rate) or the 1-year Treasury as their index rather than the prime rate. However, the prime rate still influences mortgage markets indirectly because it reflects the Fed’s overall interest rate stance.
- Personal loans: Variable-rate personal loans often use the prime rate as their benchmark. Understanding how the prime rate affects personal loan rates helps you decide between fixed and variable options.
- Auto loans: Most auto loans are fixed-rate, so they are affected indirectly. Higher prime rates push up the fixed rates lenders offer on new auto loans at origination.
What to Watch Out For
Many borrowers do not realize their credit card rate adjusts automatically with the prime rate. No notice is required beyond the original card agreement disclosures. Check your credit card’s terms for the phrase “variable APR” and identify the index it uses. If it says “Prime Rate,” your rate is moving in lockstep with Fed decisions.
If you are carrying a balance on a variable-rate credit card and the Fed signals rate cuts ahead, consider waiting to aggressively pay it down, but only if you can cover minimum payments comfortably. Conversely, before a hiking cycle, paying down variable-rate debt first is almost always the highest guaranteed “return” you can get on your money. Review your strategy using a debt payoff method like the avalanche approach to prioritize highest-rate balances first.
Step 5: When Does the Fed Typically Cut the Prime Rate?
Rate cuts happen when the Fed believes the economy is slowing, unemployment is rising, or inflation has been sufficiently tamed. Looking across rate cycles over the past five decades, five clear patterns emerge that have historically preceded cuts.
Five Signals That Historically Precede Rate Cuts
1. Inflation falling toward the 2% target: The Fed’s dual mandate requires it to balance price stability (2% inflation) and maximum employment. When the Personal Consumption Expenditures (PCE) price index, the Fed’s preferred inflation gauge, approaches 2%, rate cuts become more likely. PCE inflation was running at approximately 2.6% in mid-2025, per the Bureau of Economic Analysis.
2. Rising unemployment: The Fed cut rates aggressively in 2001 (dot-com bust), 2008 (financial crisis), and 2020 (COVID-19) specifically because unemployment spiked. When jobless claims trend higher for multiple consecutive weeks, rate cut expectations typically increase.
3. Recession signals: Two consecutive quarters of negative GDP growth is the traditional recession definition. Historically, the Fed has never maintained high rates through a full recession. Cuts almost always follow within one to two quarters of a confirmed downturn.
4. FOMC language shifts: Before cutting, the Fed typically signals through language changes in FOMC meeting statements, moving from “further policy firming may be appropriate” to “the Committee will be patient” or “monitoring risks to the outlook.”
5. Financial market stress: In 1998 (Long-Term Capital Management), 2008, and 2020, the Fed cut rates outside of scheduled meetings in response to acute financial market dislocations. These emergency cuts appear as sudden vertical drops on the historical prime rate chart.
What to Watch Out For
Rate cuts do not always lead to immediate relief on consumer loan rates. Lenders often take 30–60 days to reflect rate reductions in their product pricing, and fixed-rate products never reprice based on the prime rate. Only variable-rate products reset automatically.
As economist Dr. Claudia Sahm, creator of the Sahm Rule and formerly of the Federal Reserve Board of Governors, has noted publicly, the Fed’s mandate is price stability and maximum employment, not stock market or housing market management. Rate cuts happen when the data demands it. That distinction matters: markets have historically priced in cuts months before the Fed delivered them, and borrowers who acted on those expectations too early sometimes locked in worse terms than those who waited.
Step 6: How Do I Use the Historical Prime Rate Chart to Make Better Financial Decisions?
Beyond academic interest, a rate chart is a practical decision-making resource for anyone with a mortgage, credit card, HELOC, savings account, or investment portfolio. The key is matching your financial moves to the phase of the rate cycle, while acknowledging that you will rarely know exactly which phase you are in until it has passed.
Strategies for Each Phase of the Rate Cycle
In a rising rate environment (hiking cycle):
- Pay down variable-rate debt aggressively, starting with the highest-rate balances.
- Favor fixed-rate loans over adjustable-rate options when borrowing.
- Lock in high CD rates before the Fed stops hiking, as banks often pull their best rates as soon as rate cuts become anticipated.
- Short-duration bonds and money market accounts tend to yield more during rate hikes.
In a falling rate environment (easing cycle):
- Lock in fixed rates on mortgages before rates drop far enough to spark a refinancing rush that drives up closing costs.
- Consider refinancing variable-rate debt to fixed-rate if your current rate is well above the market.
- Extend CD durations to lock in rates before they fall further. The strategy known as a CD ladder can help manage this timing risk.
- Savings account yields typically fall within weeks of rate cuts, so high-yield accounts become less valuable.
In a stable (plateau) environment:
- Focus on personal financial fundamentals, budget, emergency fund, retirement contributions, rather than trying to time rate movements.
- Stable rate periods are historically the best times to take on fixed-rate debt for major purchases, as you face neither the urgency to “beat a hike” nor the temptation to “wait for a cut.”

What to Watch Out For
The biggest mistake consumers make is trying to perfectly time the rate cycle. Rate peaks and troughs are obvious in hindsight but nearly impossible to identify in real time. Build your financial plan around rate-cycle awareness, not rate-cycle prediction. Knowing that we are currently in a gradual easing cycle (as of July 2025) is useful context, but not a reason to delay sound financial decisions.
Bookmark the FRED Prime Rate chart and check it after each FOMC meeting, scheduled 8 times per year. Set a calendar reminder for 48 hours after each meeting to review your variable-rate account statements and update your debt payoff priorities if needed. This takes about 10 minutes and can save hundreds of dollars annually on variable-rate debt management.
Frequently Asked Questions
Where can I find a current prime rate chart updated in real time?
The best free source is the Federal Reserve Economic Data (FRED) database maintained by the Federal Reserve Bank of St. Louis. FRED updates the prime rate data within days of any Fed decision and allows you to customize the chart’s date range, from 1955 to the present. The Wall Street Journal also publishes the current prime rate on its markets data pages.
Is the prime rate the same as the federal funds rate?
No. The federal funds rate is the rate at which banks lend reserves to each other overnight, set by the Federal Reserve. The prime rate is what commercial banks charge their best corporate customers, and it is traditionally set at exactly 3 percentage points above the federal funds rate. As of July 2025, the federal funds rate target is 4.25%–4.50%, which is why the prime rate is 7.50%.
What will happen to the prime rate in 2025 and 2026?
As of July 2025, the Federal Reserve has cut the prime rate by a total of 100 basis points from its 2023 peak of 8.50%, bringing it to 7.50%. Most major financial institutions, including Wall Street Journal market surveys, project one to two additional cuts totaling 25–50 basis points by end of 2025, potentially bringing the prime rate to 7.00%–7.25% by year-end. These projections change with each new inflation and jobs report. For the most current CD rate and prime rate forecasts for 2026, follow FOMC meeting outcomes closely.
How does a rising prime rate affect my savings account?
Rising rates are generally good news for savers, because banks tend to raise yields on savings accounts, money market accounts, and CDs to compete for deposits. Traditional big-bank savings accounts typically lag rate increases significantly, sometimes by 6–12 months. High-yield savings accounts at online banks respond faster. When the prime rate rose from 3.25% to 8.50% between 2022 and 2023, the best high-yield savings accounts reached 5%+ APY, while average big-bank savings accounts barely moved above 0.50%.
What is the average prime rate historically?
Based on FRED historical data going back to 1955, the long-run average prime rate is approximately 6.5%–7%, depending on the time period measured. At 7.50%, borrowers are still in a modestly elevated rate environment by long-term standards, though nowhere near the extremes of the 1980s.
Should I get a fixed-rate or variable-rate loan when the prime rate is high?
When the prime rate is historically elevated, fixed-rate loans are generally the better choice for long-term borrowing like mortgages or auto loans. Locking in today’s rate protects you if the Fed pauses or reverses course more slowly than expected. Variable-rate products make more sense when the prime rate is near historical lows and expected to rise, because you start with a lower rate. The governing rule: never take a variable rate you cannot afford if it rises 3–5 percentage points above today’s level.
Did the prime rate ever stay flat for a very long time?
Yes. The longest flat period in modern history was 84 consecutive months from December 2008 to December 2015, when the prime rate held at exactly 3.25%. A second flat stretch occurred from March 2020 to March 2022 at the same 3.25% level, lasting 25 months. Together, these two periods represent over nine years in which the prime rate did not move, an extraordinary era of monetary policy accommodation driven first by the Global Financial Crisis and then by the COVID-19 pandemic.
How does the prime rate affect my credit score?
Directly, it does not, but it affects the cost of the debt that influences your score. When the prime rate rises, your minimum payments on variable-rate credit cards increase. If higher payments cause you to miss payments or max out your credit utilization ratio, your score will drop. Maintaining strong habits, including low utilization and on-time payments, matters even more during high-rate environments. Building credit from scratch while rates are high is challenging but achievable by following a structured credit-building strategy.
What happened to the prime rate during the 2008 financial crisis?
Rates fell from 7.25% in September 2007 to 3.25% by December 2008, a drop of 400 basis points in just 15 months. The Fed moved aggressively in response to the collapse of Lehman Brothers, the near-failure of the global banking system, and a rapidly accelerating recession. This dramatic cut is one of the most visible events on any historical prime rate chart, appearing as a near-vertical drop in late 2007 through 2008.
Why does the prime rate matter more than the federal funds rate for most consumers?
Because consumer loan contracts reference it directly. Credit card agreements, HELOC disclosures, and personal loan documents almost always cite the prime rate, not the federal funds rate, as the rate index. That means when your card issuer adjusts your APR after a Fed meeting, they are using the prime rate as the trigger, not the underlying federal funds target. Knowing the prime rate tells you exactly what your variable-rate costs are today, without any additional math.
Sources
- Federal Reserve Bank of St. Louis (FRED), Bank Prime Loan Rate Historical Data
- Federal Reserve, Federal Open Market Committee Meeting Statements and Rate Decisions
- U.S. Bureau of Labor Statistics, Historical Consumer Price Index Data
- U.S. Bureau of Economic Analysis, Personal Consumption Expenditures Price Index
- Consumer Financial Protection Bureau, What Is a Prime Rate?
- Federal Reserve Bank of St. Louis (FRED), Effective Federal Funds Rate Historical Data
- Federal Reserve Bank of New York, Natural Rate of Interest (R-Star) Research