Fact-checked by the Prime Rate editorial team
Quick Answer
The five key prime rate signal indicators are Federal Reserve meeting language, inflation data (CPI), unemployment trends, Treasury yield curve shifts, and Fed Funds Futures pricing. The federal funds rate currently holds at 4.25%–4.50%, making the prime rate 7.50%. Monitoring these signals lets you time debt payoffs, CD locks, and savings moves before a rate change takes effect.
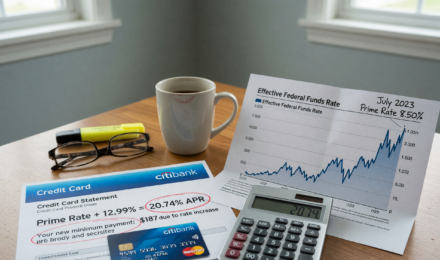
The prime rate moves in lockstep with the federal funds rate, historically set at 3 percentage points above the Fed’s target, as confirmed by the Federal Reserve’s H.15 statistical release. That relationship puts the prime rate at 7.50% right now. Understanding what causes it to shift matters for anyone carrying variable-rate debt, holding cash savings, or planning a major purchase.
A single rate move can change your credit card APR, home equity line payment, and savings yield within one billing cycle. Knowing what to watch, and acting before the announcement, is where the real financial advantage lives.
Key Takeaways
- The prime rate is currently 7.50%, set at exactly 3 percentage points above the federal funds rate target of 4.25%–4.50%, per the Federal Reserve’s H.15 release.
- The Fed’s median dot plot projection, published four times per year, telegraphs rate moves well in advance; a shift of 25 basis points or more in the median is a near-certain signal, according to FOMC meeting materials.
- Core PCE inflation above 2.5% consistently delays rate cuts, while readings at or below 2.2% have historically preceded a dovish pivot within 60 days, per BEA PCE data.
- Nonfarm payrolls falling below 100,000 jobs per month for two consecutive months is one of the strongest labor-side signals for an imminent cut, based on BLS employment data.
- When the CME FedWatch Tool shows a cut probability above 70% for a specific FOMC meeting, markets have essentially made their decision and the Fed rarely surprises.
- The optimal financial preparation window is 4 to 8 weeks before an FOMC decision, giving you time to lock CDs above 4.5% APY before a cut or accelerate variable-rate debt payoffs before a hike.
What Does Federal Reserve Language Signal About Rate Moves?
The clearest prime rate signal indicators come directly from the Federal Open Market Committee (FOMC) itself. The Fed communicates its intentions through post-meeting statements, the Summary of Economic Projections (SEP), and the Chair’s press conference, a practice known as forward guidance.
Specific word choices carry enormous weight. A shift from “patient” to “data-dependent” in an FOMC statement, or from “restrictive” to “less restrictive” to describe current policy, historically precedes a rate change within one to two meetings. That kind of linguistic signal is not accidental. The Fed’s communications team refines every adjective deliberately, and bond traders read each statement word by word.
How to Read the Dot Plot
The dot plot, published four times per year in the SEP, shows where each FOMC member expects rates to land at year-end. When the median dot shifts downward by 25 basis points or more between releases, a cut is effectively telegraphed.
Pay close attention to the “longer run” dot as well. A rising longer-run rate signals a structurally higher prime rate environment, meaning variable-rate debt costs more for longer. That distinction matters if you are deciding between a fixed-rate loan and a HELOC today.
Why Press Conference Tone Often Matters More Than the Statement
The written FOMC statement is reviewed by committee and tends to be measured. The Chair’s live press conference is where you hear unscripted emphasis. Markets frequently move more on a single phrase from the press conference than on the full statement. Phrases that imply patience (such as “we are in no hurry”) have a demonstrable effect on futures pricing within minutes of being spoken. Listening to or reading the full transcript, not just the headlines, gives you a more complete picture of where policy is heading.
Key Takeaway: FOMC forward guidance is the most reliable prime rate signal. The Fed’s dot plot and post-meeting press conferences together give you the earliest and most authoritative read on where the prime rate is headed.
What Does Inflation Data Signal About Prime Rate Changes?
Inflation is the Fed’s primary policy trigger, making CPI and PCE readings the most actionable prime rate signal indicators available to ordinary consumers. The Fed’s explicit inflation target is 2.0%, measured by the Personal Consumption Expenditures (PCE) price index.
When headline CPI or core PCE consistently prints above that target, as it did throughout 2022 and 2023, the Fed raises rates. When inflation falls sustainably toward 2%, the bias shifts toward cuts. The 9.1% CPI peak reached in June 2022 forced one of the most aggressive tightening cycles in modern Fed history. The subsequent decline in inflation has been the central story of the rate environment since.
Core PCE vs. Headline CPI: Which Matters More?
The Fed officially targets core PCE, which strips out volatile food and energy prices. Core PCE running above 2.5% for multiple consecutive months is a reliable signal that rate cuts will be delayed. Conversely, two or three months of core PCE at or below 2.2% historically have triggered a pivot in Fed language within 60 days.
Headline CPI is useful for context and tends to get more media attention, but core PCE is the number the Fed actually uses to calibrate decisions. Tracking both gives you the full picture: headline CPI tells you what consumers are experiencing at the register, while core PCE tells you what the Fed is watching in its models.
Watch the monthly release dates for both reports. The Bureau of Economic Analysis publishes PCE data roughly 30 days after month-end, giving you a preview of the Fed’s next move before the FOMC meets.
How Inflation Surprises Move Markets Immediately
CPI and PCE releases are scheduled well in advance, and the reaction to each print is often outsized relative to the actual data change. A CPI reading that comes in 0.1 percentage points above consensus can send Treasury yields sharply higher within seconds of release, repricing Fed Funds Futures almost instantly. This means individual investors who track release dates can observe market-based rate signals the same day the data drops, without waiting for official Fed commentary.
For practical purposes, set a calendar reminder for each monthly CPI release from the Bureau of Labor Statistics and each PCE release from the Bureau of Economic Analysis. The dates are published months in advance and are fixed reference points in the Fed’s decision cycle.
Core PCE above 2.5% signals rate cuts are unlikely in the near term; readings at or below 2.2% historically precede a dovish pivot. Track monthly BEA PCE releases as your primary inflation signal. One honest caveat: PCE data arrives about 30 days after month-end, so by the time you see a number that looks encouraging, the futures market has usually already priced it in. The signal is still worth watching, but do not expect to be ahead of professional traders on this one.
| Prime Rate Signal | What to Watch | Rate-Cut Threshold |
|---|---|---|
| Fed Dot Plot | Median year-end projection | Median shifts down 25+ bps |
| Core PCE Inflation | Monthly BEA release | Sustained readings at or below 2.2% |
| Unemployment Rate | Monthly BLS jobs report | Rate rises above 4.5% for 2+ months |
| Treasury Yield Curve | 2-year vs. 10-year spread | Curve re-steepens after inversion |
| Fed Funds Futures | CME FedWatch Tool probability | Cut probability exceeds 70% |
What Does the Jobs Report Signal for the Prime Rate?
Labor market data is the second half of the Fed’s dual mandate (maximum employment) and it directly shapes prime rate signal indicators. A weakening jobs market gives the Fed economic cover to cut rates; a strong one keeps them on hold or pushes them higher.
The monthly nonfarm payrolls report, published by the Bureau of Labor Statistics on the first Friday of each month, is the single most market-moving data release outside of FOMC meetings. When payroll additions fall below approximately 100,000 for two consecutive months, or when the unemployment rate climbs above 4.5%, markets price in cuts rapidly.
JOLTS and Initial Jobless Claims as Leading Indicators
The Job Openings and Labor Turnover Survey (JOLTS) and weekly initial jobless claims data provide earlier signals than the headline payrolls number. A sustained rise in initial claims above 250,000 per week signals labor market softening. JOLTS job openings dropping below 7 million has historically correlated with rate cut cycles beginning within six months.
Initial jobless claims deserve particular attention because they are published every Thursday, making them one of the most frequent high-frequency economic reads available. A single week of elevated claims rarely moves markets, but three or four consecutive weeks above trend will draw Fed commentary quickly.
Labor market data often arrives weeks before the FOMC meets, which means a sharp deterioration in claims or payrolls can shift the probability landscape substantially before anyone speaks at a press conference. The jobs data and inflation data work together: if both weaken simultaneously, the case for cuts becomes much harder for the Fed to resist, regardless of where the dot plot stood at the prior meeting.
Nonfarm payrolls falling below 100,000 per month for two straight months is a strong prime rate cut signal. Monitor the BLS monthly jobs report and weekly jobless claims to stay ahead of any FOMC pivot. That said, a single weak payrolls print should not trigger financial moves on its own. Revisions are common, sometimes substantial, and one bad month frequently gets revised upward the following release.
What Do Treasury Yields and Fed Futures Signal About Rate Moves?
Bond markets and futures contracts are real-time prime rate signal indicators that price in rate expectations before the Fed officially acts. These tools reflect what professional traders collectively believe will happen, often with more precision than any single economic report.
The CME FedWatch Tool aggregates Fed Funds Futures pricing to assign a percentage probability to each possible rate outcome at every upcoming FOMC meeting. When the cut probability for a specific meeting exceeds 70%, the market has made up its mind. The Fed rarely surprises in those situations. A probability below 50% means genuine uncertainty remains, and it is too early to act on that signal alone.
Reading the Treasury Yield Curve
The relationship between the 2-year Treasury yield and the 10-year Treasury yield is a powerful leading indicator. An inverted curve (2-year above 10-year) signals that traders expect rate cuts ahead. When the curve begins to re-steepen, meaning the 10-year rises relative to the 2-year, it often marks the early phase of an actual rate-cut cycle, not just an expectation of one.
There is an important distinction worth understanding here. An inverted curve tells you what the market expects. A re-steepening curve tells you the market believes cuts are now actually beginning. Those are different stages of the same cycle, and they call for different financial moves. During an inversion, you should be watching and preparing. During a re-steepening, you should already be acting.
If you hold variable-rate debt such as a home equity line of credit, watching the 2-year Treasury gives you roughly a 3- to 6-month preview of where your borrowing rate is headed. And if you are watching how rate shifts flow into lending products more broadly, understanding how the prime rate affects personal loan rates helps you time any new borrowing strategically.
Why Bond Markets Sometimes Get It Wrong
Futures pricing reflects collective market expectations, not certainty. There have been periods (most visibly in 2023) when markets priced in multiple cuts that never materialized because inflation remained stickier than anticipated. Treating a 70% FedWatch probability as a guarantee is a mistake. Treating it as a strong enough signal to begin preparing your finances is reasonable. The difference is in how you act: position gradually, and do not make irreversible financial commitments based on futures pricing alone.
When the CME FedWatch Tool shows a cut probability above 70% and the Treasury yield curve begins re-steepening, a prime rate reduction is close. These market-based prime rate signal indicators typically lead the official announcement by 4 to 8 weeks. The limitation to keep in mind: futures markets have a demonstrable history of over-pricing cuts that never arrive, particularly when inflation data turns out stickier than forecast.
How Do All Five Signals Work Together?
No single indicator should be read in isolation. The most reliable picture of an approaching rate move comes when multiple signals align simultaneously.
Consider what a convergence of signals looks like in practice. The FOMC statement softens its language about holding rates “for longer.” Core PCE prints two consecutive months below 2.3%. Weekly jobless claims tick above 230,000 for three straight weeks. The CME FedWatch Tool moves from 45% to 65% probability of a cut at the next meeting. The 2-year Treasury yield drops 30 basis points over six weeks while the 10-year holds steady, narrowing the inversion.
Each of those events alone might be a false signal. Together, they constitute a credible case for action. This is the pattern that has historically preceded actual FOMC rate moves, and it is worth training yourself to recognize it.
Distinguishing a Real Signal from Noise
Financial news generates enormous volumes of commentary between FOMC meetings. Not all of it is signal. Regional Fed presidents give speeches with views that may differ from the committee’s consensus. Single data points often reverse the following month. A one-week spike in jobless claims is noise; four consecutive weeks of increases are a pattern worth noting.
The practical filter: weight official FOMC communications highest, weight sustained trends in economic data second, and treat individual data releases and media speculation as context rather than conclusions. That hierarchy keeps you from overreacting to headlines while still staying informed.
How Signals Differ Depending on Rate Direction
The five signals described in this article apply to both rate cuts and rate hikes, but the indicators to emphasize differ depending on which direction you are watching for. When watching for a coming hike, inflation data and FOMC language carry the most weight. Core PCE moving above 3% while the Fed shifts to more hawkish language is a clear combination. When watching for cuts, the labor market data matters more because the Fed is more willing to look past slightly elevated inflation if unemployment is rising noticeably.
Understanding this asymmetry helps you allocate your monitoring attention more efficiently. You do not need to watch all five signals with equal intensity at all times.
Convergence across multiple signals is more reliable than any single indicator. Prioritize FOMC language and official economic releases over media commentary, and recognize that the signals most worth watching shift depending on whether you are monitoring for cuts or hikes.
How Should You Prepare Your Finances Before a Prime Rate Move?
Once you have identified credible prime rate signal indicators, the preparation window is short: typically four to eight weeks before an FOMC meeting. Acting inside that window lets you lock in favorable rates or accelerate debt payoffs before the shift hits your accounts.
If signals point to a rate cut, lock in high-yield savings and CD rates before they drop. Current top-yielding CDs are still paying above 4.5% APY, but those rates will compress quickly after a cut. Reviewing the best CD rates available right now and understanding the 2026 CD rate forecast helps you decide whether to lock in a 12-month or 24-month term today.
If signals point to a rate hike, accelerate payoffs on variable-rate debt, especially credit cards. Credit card APRs move in direct proportion to the prime rate, and a single 25-basis-point hike adds roughly $25 per year in interest for every $10,000 of revolving balance. Applying even an extra $100 per month toward the highest-rate card before the announcement can save hundreds in interest over the following year.
Three Moves to Make Now
- Lock a CD or high-yield savings account if cut signals are strong. Compare CD rates vs. high-yield savings to choose the right vehicle for your timeline.
- Pay down variable-rate balances if hike signals dominate. Target credit cards and HELOCs first, since both are directly tied to prime.
- Review your emergency fund, a rate cut reduces the yield on liquid savings, so ensure your fund is sized correctly before returns compress.
The Case for Acting Gradually Rather Than All at Once
Rate timing is not a precision science. Even when all five signals align, a Fed watching the same data can pause, delay, or surprise markets. Spread your moves over several weeks rather than making one large financial decision on the day FedWatch crosses 70%.
For CD laddering, this might mean opening one shorter-term CD immediately and reserving funds for a second once confirmation arrives. For debt payoff, it means increasing your monthly payment now rather than waiting until the announcement to make a lump sum. Gradual positioning reduces the cost of being slightly wrong on timing while still capturing most of the benefit of acting before a rate change.
The goal is not to predict the exact meeting where the Fed acts. It is to be better positioned than someone who waited for the announcement to appear in the news.
Key Takeaway: The optimal preparation window is 4 to 8 weeks before an FOMC decision. Lock CDs above 4.5% APY before a cut, and accelerate variable-rate debt payoffs before a hike. Act gradually rather than all at once to manage the risk of imprecise timing.
Frequently Asked Questions
What is the prime rate right now in 2025?
The prime rate is currently 7.50%, set at exactly 3 percentage points above the federal funds rate target of 4.25%–4.50%. This rate has been unchanged since the Fed’s last adjustment in December 2024.
How much notice do you get before the prime rate changes?
The FOMC publishes its meeting schedule a year in advance, so you always know when a decision can occur. In practice, markets price in the most likely outcome 4 to 8 weeks before the meeting, giving you a usable preparation window if you track prime rate signal indicators regularly.
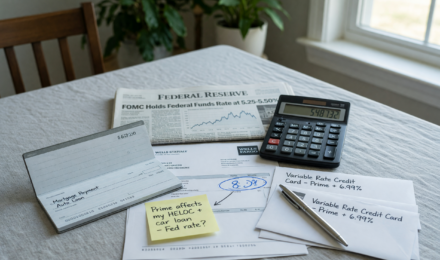
Does the prime rate affect my mortgage interest rate?
Fixed-rate mortgages are not directly tied to the prime rate, they follow 10-year Treasury yields. Adjustable-rate mortgages (ARMs) and home equity lines of credit (HELOCs), by contrast, are directly indexed to prime and will adjust within one billing cycle of a rate change.
What is the CME FedWatch Tool and how do I use it?
The CME FedWatch Tool calculates the probability of each possible federal funds rate outcome at upcoming FOMC meetings, based on real-time futures contract pricing. A probability above 70% for a specific outcome is generally considered a near-certain signal by professional traders.
What happens to my credit card APR when the prime rate moves?
Most variable-rate credit cards are priced as prime plus a fixed margin, typically prime plus 14 to 20 percentage points. A 25-basis-point prime rate increase adds the same to your card’s APR within one to two billing cycles. Paying down balances before a hike is the most direct way to reduce exposure.
How often does the Fed meet to set the prime rate?
The FOMC meets eight times per year at scheduled intervals, approximately every six to eight weeks. Emergency, unscheduled meetings can occur during financial crises, as seen in March 2020, but are rare under normal economic conditions.
Can the prime rate move by more than 25 basis points at one meeting?
Yes. The Fed typically moves in 25-basis-point increments, but it has acted in larger steps during periods of acute inflation pressure. In 2022, the FOMC delivered four consecutive 75-basis-point hikes as it worked to bring inflation down from a 40-year high. Larger moves are historically uncommon, but they are not off the table when conditions deteriorate rapidly.
Does a falling prime rate automatically mean my HELOC payment goes down?
Generally, yes, but the timing depends on your lender’s repricing cycle. Most HELOCs adjust on a monthly or quarterly basis tied to the prime rate, so a cut in the federal funds rate will flow through to your HELOC statement within one to three billing cycles. Check your loan agreement for the specific index and repricing frequency.
What is the difference between the federal funds rate and the prime rate?
The federal funds rate is the rate at which banks lend reserves to each other overnight; it is set directly by the FOMC. The prime rate is a benchmark banks use to price consumer and commercial loans, conventionally set 3 percentage points above the federal funds rate target. The Fed does not officially set the prime rate, but because major banks follow that convention uniformly, the two move together in practice.
Is it possible for the prime rate to move between scheduled FOMC meetings?
It is possible, but rare. The Fed has used emergency intermeeting cuts during severe market disruptions, including in March 2020 at the onset of the COVID-19 pandemic and in 2001 following the September 11 attacks. Outside of crisis conditions, rate changes happen only at the eight scheduled FOMC meetings per year. If you see speculation about an emergency cut in normal economic conditions, treat it as noise rather than signal.
Sources
- Federal Reserve, H.15 Selected Interest Rates (Prime Rate Data)
- Federal Reserve, FOMC Meeting Calendar and Statements
- U.S. Bureau of Labor Statistics, Consumer Price Index News Release
- U.S. Bureau of Labor Statistics, Employment Situation Summary
- U.S. Bureau of Economic Analysis, Personal Consumption Expenditures Price Index
- Federal Reserve, March 2025 Summary of Economic Projections (Dot Plot)