Fact-checked by the Prime Rate editorial team
You lock in a 30-year mortgage at 3.1% in early 2021, feeling like you have won the lottery. Then, just 18 months later, that same loan costs 7.08%, more than double. The monthly payment on a $400,000 home jumps by nearly $1,100 overnight for new buyers. That is not a hypothetical scenario. It happened to millions of Americans, and the prime rate housing market relationship was at the center of it all.
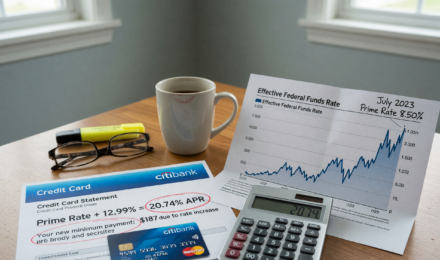
The Federal Reserve raised the federal funds rate 11 times between March 2022 and July 2023, pushing the prime rate from 3.25% to 8.50%, its highest level since 2001. According to the Federal Reserve’s H.15 statistical release, the prime rate directly influences the borrowing costs tied to adjustable-rate mortgages, home equity lines of credit, and construction loans. During that same period, existing home sales fell 38% from their 2021 peak, according to the National Association of Realtors. Housing affordability hit a 40-year low in 2023.
This guide explains exactly how prime rate shifts ripple through every corner of real estate: from the mortgage you carry to the value of your home, from builder confidence to rental demand. You will walk away knowing which loan types are most exposed, how to time major decisions around rate cycles, and what specific steps to take right now whether you are buying, selling, refinancing, or holding.
Key Takeaways
- The prime rate rose from 3.25% to 8.50% between March 2022 and July 2023, a 525-basis-point increase in just 16 months.
- A 1% increase in mortgage rates reduces home-buying power by approximately 10%, meaning a buyer who could afford a $500,000 home at 6% can only afford $450,000 at 7%.
- Home equity lines of credit (HELOCs) are directly pegged to the prime rate, so a 2% prime rate hike translates to roughly $83 more per month on a $50,000 HELOC balance.
- Existing home sales dropped from a seasonally adjusted annual rate of 6.49 million in January 2021 to 3.79 million by October 2023, a 42% collapse tied largely to rate shock.
- Adjustable-rate mortgage (ARM) originations surged to 12.8% of all mortgage applications in mid-2022, up from just 3% in 2021, as buyers sought relief from rising fixed rates.
- Homebuilder sentiment, measured by the NAHB/Wells Fargo Housing Market Index, fell from a record 90 in November 2020 to a low of 31 in December 2022, mirroring the prime rate climb almost exactly.
In This Guide
- What the Prime Rate Actually Is, and Why Housing Cares
- How the Prime Rate Moves Mortgage Rates
- HELOCs and Home Equity Loans: The Direct Hit
- Buying Power, Affordability, and the Rate-Price Squeeze
- How Rate Cycles Reshape Home Values and Inventory
- Builder Confidence and New Construction Slowdowns
- The Ripple Effect on the Rental Market
- Adjustable-Rate Mortgages and Hidden Rate Risk
- Timing the Market: What History Tells Us About Rate Cycles
- Prime Rate Strategies for Buyers, Sellers, and Homeowners
What the Prime Rate Actually Is, and Why Housing Cares
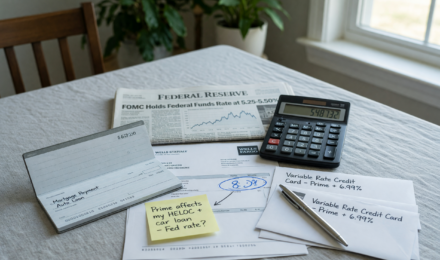
The prime rate is the benchmark interest rate that U.S. banks use to price loans for their most creditworthy customers. It is set by individual banks but almost universally pegged at 3 percentage points above the federal funds rate target set by the Federal Open Market Committee (FOMC). When the Fed moves, the prime rate moves, usually the same day.
As of 2025, the prime rate sits at 7.50%, following a series of Fed rate cuts that began in September 2024. Before those cuts, it had held at 8.50% for over a year, a level not seen since the early 2000s. Understanding this benchmark is the first step to understanding every major housing cost in your life.
The Federal Funds Rate Connection
The federal funds rate is the rate at which banks lend reserves to each other overnight. It does not directly set your mortgage rate, but it sets the floor for the entire cost-of-capital structure in the economy. The prime rate sits one layer above it, and mortgage rates sit one layer above that.
Think of it as a chain: Fed policy moves the federal funds rate, which moves the prime rate, which moves HELOC rates, ARM rates, and the broader bond market that determines fixed mortgage rates. Each link in that chain amplifies or dampens the original signal.
Why the Housing Sector Is Uniquely Sensitive
No sector of the economy is more leveraged to interest rates than housing. A typical homebuyer borrows 80% or more of a home’s purchase price over 30 years. Tiny changes in borrowing costs therefore create enormous changes in total cost paid. On a $400,000 mortgage, the difference between 4% and 7% interest is over $250,000 in total interest paid over the life of the loan.
Unlike stocks or bonds, a home is also the single largest asset most Americans hold. According to the Federal Reserve’s 2023 Survey of Consumer Finances, the primary residence accounts for roughly 26% of total household assets for the median American family. Rate shifts do not just affect your payment. They affect your net worth.
The prime rate has changed 38 times since 2000, ranging from a historic low of 3.25% (held from December 2008 to December 2015) to a high of 8.50% reached in July 2023.
How the Prime Rate Moves Mortgage Rates
Fixed-rate mortgages do not directly follow the prime rate. Instead, they track the yield on the 10-year U.S. Treasury note, which responds to the same inflation expectations and Fed signals that drive the prime rate. The two tend to move in the same direction, but the correlation is not one-to-one.
Adjustable-rate mortgages are much more directly tied to the prime rate or other short-term benchmarks like SOFR (the Secured Overnight Financing Rate, which replaced LIBOR). When the prime rate rises, ARM holders feel it almost immediately at their next adjustment date.
Fixed vs. Adjustable: Two Different Transmission Channels
| Mortgage Type | Rate Benchmark | Response to Prime Rate Hike | Typical Lag Time |
|---|---|---|---|
| 30-Year Fixed | 10-Year Treasury Yield | Indirect, moves with bond market sentiment | Days to weeks |
| 15-Year Fixed | 5-Year Treasury Yield | Indirect, slightly more sensitive than 30-year | Days to weeks |
| 5/1 ARM | SOFR / Treasury index | Direct after initial fixed period expires | At annual reset |
| HELOC | Prime Rate | Direct, adjusts monthly or quarterly | 30-90 days |
| Construction Loan | Prime Rate | Direct, variable rate during build phase | Immediate |
The Spread Between Prime Rate and Mortgage Rates
Historically, the 30-year fixed mortgage rate runs about 1.5 to 2 percentage points above the 10-year Treasury yield. During periods of market stress, like 2022 and 2023, that spread widened to over 3 percentage points. Lenders priced in uncertainty, and borrowers paid the premium.
This spread widening is a hidden amplifier. Even when the Fed paused rate hikes in 2023, mortgage rates stayed elevated because the spread remained stubbornly wide. Understanding this nuance matters for timing refinancing or purchase decisions. For a deeper look at how these dynamics play out on your home loan specifically, read our guide on how the prime rate affects your mortgage and home equity loan.
The average 30-year fixed mortgage rate peaked at 7.79% in October 2023, the highest since November 2000, according to Freddie Mac’s Primary Mortgage Market Survey.
HELOCs and Home Equity Loans: The Direct Hit
If fixed mortgages feel the prime rate indirectly, home equity lines of credit (HELOCs) feel it directly and immediately. Most HELOCs are priced at prime rate plus a margin, typically prime + 0.5% to prime + 2%, depending on creditworthiness. When the prime rate was 8.50%, a borrower with average credit was paying 10% or more on their HELOC balance.
American homeowners collectively held $393 billion in HELOC balances as of Q4 2023, according to the Federal Reserve Bank of New York. That is $393 billion in floating-rate debt that moved in near-lockstep with every Fed rate decision made during the hiking cycle.
The Math Behind a HELOC Rate Shock
| HELOC Balance | Rate at Prime 3.25% (2021) | Rate at Prime 8.50% (2023) | Monthly Payment Increase |
|---|---|---|---|
| $25,000 | 3.75% = $78/mo (interest only) | 9.00% = $188/mo | +$110/month |
| $50,000 | 3.75% = $156/mo | 9.00% = $375/mo | +$219/month |
| $100,000 | 3.75% = $313/mo | 9.00% = $750/mo | +$437/month |
| $200,000 | 3.75% = $625/mo | 9.00% = $1,500/mo | +$875/month |
Home Equity Loans vs. HELOCs in a Rising Rate Environment
Unlike HELOCs, home equity loans carry fixed interest rates set at closing. This makes them more predictable during rate hikes, but also means you lock in whatever rate is current at the time you borrow. Borrowers who locked into home equity loans in 2020 or early 2021 are sitting on historically cheap debt. Those who waited until 2022 or 2023 paid significantly more.
The strategic implication is clear: in a rising rate environment, convert HELOC balances to fixed home equity loans early. In a falling rate environment, wait, or use a HELOC to take advantage of declining rates. This is one area where understanding the prime rate housing market cycle pays off in real dollars.
If you have a HELOC with a large outstanding balance, even a 0.25% rate increase costs you real money each month. A $100,000 balance exposed to a 2% rate hike costs an extra $167 per month, $2,000 per year, without you spending one more dollar on your home.
Buying Power, Affordability, and the Rate-Price Squeeze
The most immediate way most people experience the prime rate housing market is through purchasing power. When rates rise, buyers qualify for smaller loans. When they fall, purchasing power expands. This inverse relationship is the engine behind housing market cycles.
The National Association of Realtors’ Housing Affordability Index fell to 95.0 in October 2023, the first time it had dropped below 100 (where 100 means a median-income family can exactly afford a median-priced home) since 1985. By that point, buying power had eroded by tens of thousands of dollars compared to just two years earlier.
How Rate Changes Translate to Dollar-for-Dollar Buying Power
| Interest Rate | Monthly Payment Budget: $2,000 | Affordable Loan Amount | Change from 3% Baseline |
|---|---|---|---|
| 3.0% | $2,000/month | $474,000 | Baseline |
| 4.0% | $2,000/month | $418,000 | -$56,000 (-12%) |
| 5.0% | $2,000/month | $373,000 | -$101,000 (-21%) |
| 6.0% | $2,000/month | $333,000 | -$141,000 (-30%) |
| 7.0% | $2,000/month | $299,000 | -$175,000 (-37%) |
| 8.0% | $2,000/month | $272,000 | -$202,000 (-43%) |
The Lock-In Effect: Why Sellers Aren’t Selling
The rate-price squeeze has a secondary effect that most buyers don’t immediately see: the lock-in effect. Homeowners who secured 2.5% to 3.5% mortgages during the pandemic era have little financial incentive to sell and take on a new mortgage at 6.5% to 7.5%. Many are effectively trapped in their current homes by their own favorable rates.
According to a Redfin analysis from 2023, approximately 82% of outstanding mortgages had rates below 5% at the peak of the rate-hike cycle. That created a massive inventory shortage: homeowners unwilling to move meant fewer homes on the market, which kept prices elevated even as demand fell. Buyers faced the worst of both worlds, with high rates and high prices simultaneously.
“The lock-in effect is the defining feature of this housing cycle. We have never seen such a large share of homeowners with mortgage rates so far below current market rates. It has essentially frozen supply at exactly the moment demand was already falling.”

How Rate Cycles Reshape Home Values and Inventory
Many people assume higher rates always cause home prices to fall. The historical record is more complicated. In normal market cycles, rising rates do compress prices by reducing demand. The 2022-2023 cycle showed, however, that when supply is sufficiently constrained, prices can remain sticky even as transaction volume collapses.
The S&P CoreLogic Case-Shiller National Home Price Index fell just 5% from its June 2022 peak to its January 2023 trough, a modest correction considering how dramatically affordability had deteriorated. In most major metros, prices never fell at all. By early 2024, they had already surged to new all-time highs in many markets.
Regional Variation in Rate Sensitivity
Rate sensitivity is not uniform across markets. High-cost coastal cities like San Francisco, Seattle, and New York experienced more pronounced price drops because buyers at the margin were stretching their budgets further. Sun Belt markets like Phoenix, Austin, and Tampa, which had seen frenzied pandemic-era price appreciation, also saw sharper corrections.
More affordable Midwest markets like Columbus, Indianapolis, and Kansas City barely flinched. Buyers there had more cushion between their incomes and home prices, making rate increases painful but not market-collapsing.
Inventory Dynamics: The Supply Side of the Equation
Active listings for existing homes hit a record low of 860,000 in January 2022, according to NAR data. Even as rates rose and demand fell, new listings remained suppressed by the lock-in effect. The result was a market with fewer sellers, fewer buyers, and dramatically fewer completed transactions, not a crash, but a deep freeze.
New home builders actually gained market share during this period. Unable to find existing inventory, some buyers turned to new construction, and builders competed by offering mortgage rate buydowns and incentives. This unusual dynamic made 2023 the first year in modern history where new home sales volumes exceeded existing home sales volumes on a relative market-share basis.
During the 2022-2023 rate hike cycle, months of supply for existing homes never exceeded 4.0 months, well below the 6.0 months considered a balanced market. This supply constraint is a major reason home prices did not crash despite sharply higher rates.
Builder Confidence and New Construction Slowdowns
The impact on homebuilders is one of the most direct and measurable channels through which the prime rate housing market relationship plays out. Construction financing, the loans builders use to fund projects, is typically tied to the prime rate. When the prime rate rises, so does the cost of every spec home under construction.
The NAHB/Wells Fargo Housing Market Index (HMI), which measures builder confidence on a scale of 0-100, plunged from a record high of 90 in November 2020 to a low of 31 in December 2022. Any reading below 50 indicates more builders view conditions as poor than good. That 59-point collapse happened in just 25 months.
The Cost Structure of New Construction in a High-Rate Environment
Builders face a double squeeze when rates rise. First, their construction financing costs increase directly. Second, their potential buyers qualify for smaller loans, reducing the pool of purchasers for completed homes. Many builders responded by downsizing floor plans, cutting optional upgrades, and offering rate buydowns, sometimes permanently buying down the mortgage rate to 5% or lower using 2-1 or 3-2-1 buydown structures.
DR Horton, the nation’s largest homebuilder, reported in its 2023 annual report that it spent an average of $19,000 per home in incentives, including rate buydowns, to maintain sales velocity. That is a direct, measurable cost of the high-rate environment embedded in every new home sold.
Single-Family Starts vs. Multifamily: Diverging Paths
Single-family housing starts fell 28% from their 2021 peak by mid-2023. Multifamily construction, however, remained elevated, driven by rental demand from would-be buyers priced out of homeownership. This bifurcation reflects how rate cycles reshape not just who buys homes, but what kind of housing gets built.
Single-family housing starts fell from 1.1 million annually in 2021 to approximately 790,000 in early 2023, a 28% decline directly correlated with the Fed rate-hiking cycle.
The Ripple Effect on the Rental Market
When buying becomes unaffordable, renting becomes the default. This is one of the most consistent and powerful ripple effects in the prime rate housing market chain. Higher mortgage rates push would-be buyers into the rental market, increasing demand for apartments and single-family rentals simultaneously.
According to Apartment List’s national rent research, national rents rose 26% in the two years following the start of the pandemic, partly driven by pent-up household formation and partly by the rate-driven affordability collapse pushing renters to stay put longer.
The Rent vs. Buy Calculation in a High-Rate World
| Scenario | Buying at 7% (30-yr fixed) | Renting Equivalent Unit | Monthly Cost Difference |
|---|---|---|---|
| $350,000 Home (20% Down) | $1,863/mo P&I + taxes/insurance ≈ $2,400 | Average 2BR rent: $1,620/mo | Buying costs +$780/month |
| $500,000 Home (20% Down) | $2,661/mo P&I + taxes/insurance ≈ $3,350 | Average 2BR rent: $1,620/mo | Buying costs +$1,730/month |
| $350,000 Home (20% Down) at 4% | $1,337/mo P&I + taxes/insurance ≈ $1,900 | Average 2BR rent: $1,350/mo | Buying costs +$550/month |
Investor Activity and the Single-Family Rental Market
Institutional investors recognized the rental demand surge early. Large single-family rental operators like Invitation Homes and American Homes 4 Rent saw occupancy rates remain above 97% throughout 2022 and 2023. When mortgage rates make buying expensive for families, rental properties tend to become more valuable for investors, creating a feedback loop that can further reduce for-sale inventory.
For renters trying to build toward eventual homeownership, this period highlighted the importance of growing savings aggressively. Knowing how to maximize yield on your cash reserves, whether through high-yield savings accounts or other instruments, becomes critical when the timeline to buying extends unexpectedly.
High mortgage rates transformed millions of potential homebuyers into long-term renters, often against their wishes. That structural shift in rental demand kept occupancy rates elevated and rent growth positive even as the broader economy showed signs of slowing, according to RealPage Analytics data from the period.
Adjustable-Rate Mortgages and Hidden Rate Risk
When 30-year fixed rates hit 7% and above, buyers searching for any affordability relief turned to adjustable-rate mortgages (ARMs). ARM originations jumped from roughly 3% of all mortgage applications in 2021 to 12.8% by mid-2022, according to the Mortgage Bankers Association. That represents hundreds of thousands of borrowers taking on floating-rate risk.
ARMs offer a lower initial rate for a fixed period, typically 5, 7, or 10 years, before adjusting annually based on a benchmark index. The appeal is real: a 5/1 ARM in 2022 might carry a 5.5% initial rate versus 7% for a 30-year fixed, saving hundreds of dollars per month in early years. But the back-end risk is also real.
How ARM Adjustments Work, and Where the Risk Lives
Most modern ARMs have built-in rate caps. A typical 5/2/5 cap structure means the rate can rise a maximum of 5% at the first adjustment, 2% per year thereafter, and 5% over the life of the loan. Those caps still allow for substantial payment shock. A $400,000 ARM that starts at 5.5% and adjusts to its cap of 10.5% sees the monthly payment jump from $2,271 to $3,697, a $1,426 monthly increase.
For borrowers who used ARMs to squeeze into homes at the top of their budget, that adjustment can be devastating. To understand the full spectrum of how the prime rate affects your borrowing costs across product types, see our explainer on how the prime rate affects credit card interest rates, the same mechanism applies to floating-rate mortgage products.
ARM Refinancing Strategy: The Window of Opportunity
Borrowers who took ARMs in 2022 with 5-year fixed periods will face their first adjustment around 2027. If rates have fallen by then, a real possibility given the Fed’s easing trajectory, refinancing into a fixed rate before the first adjustment is the optimal play. Monitoring the rate environment in 2025 and 2026 is therefore critical for ARM holders.
If you have a 5/1 or 7/1 ARM taken out in 2021 or 2022, set a calendar reminder 12 months before your first adjustment date to evaluate refinancing options. Even a modest drop in fixed rates by then could lock in savings for the remaining life of your loan.
Timing the Market: What History Tells Us About Rate Cycles
The prime rate housing market relationship follows historical patterns worth understanding, not to perfectly time the market (an impossible goal), but to make informed, defensible decisions about when to act.
Historically, the Fed has raised rates aggressively to fight inflation, held them at peak for 6-18 months, then cut them gradually. The 2022-2024 cycle followed this pattern closely. The Fed began cutting in September 2024 and is widely expected to continue a gradual easing path through 2025 and 2026, according to FOMC projections.
Historical Rate Cycles and Their Housing Market Outcomes
| Rate Cycle | Prime Rate Peak | Duration of Hikes | Home Price Impact | Sales Volume Impact |
|---|---|---|---|---|
| 1979-1981 | 21.5% | 24 months | -10% nominal | -40% sales volume |
| 1994-1995 | 9.0% | 12 months | Flat / slight decline | -10% sales volume |
| 1999-2000 | 9.5% | 12 months | +5% (tech boom supported) | -8% sales volume |
| 2004-2006 | 8.25% | 24 months | +20% then -30% crash | Delayed collapse |
| 2022-2023 | 8.50% | 16 months | -5% then recovery | -42% sales volume |
What “Rates Are Falling” Actually Means for Housing
Many buyers assume that falling rates will immediately unlock a buyer’s market with abundant inventory and stable prices. History suggests the opposite often happens. When rates fall, suppressed demand floods back into the market simultaneously. Sellers who were locked in suddenly list. Buyers who were waiting leap off the sidelines. The result is often a surge in competition and prices, not a buyer’s paradise.
The 2019 mini-rate-cut cycle offers a preview: the Fed cut rates three times, and home prices in most markets jumped 4-6% within 12 months. Anyone waiting for rates to fall before buying should plan for prices to rise in parallel, potentially offsetting much of the mortgage savings.
The phrase “marry the house, date the rate” became widespread in 2022-2023, encouraging buyers to purchase now and refinance later. While strategically sound in many cases, this advice only works if you can comfortably afford the current payment, not just the future anticipated payment.
Prime Rate Strategies for Buyers, Sellers, and Homeowners
Understanding the prime rate housing market is only useful if it informs concrete decisions. Whether you are trying to buy your first home, sell an existing one, tap your equity, or simply protect your financial position, the rate environment should shape your approach.
For buyers, the key is separating what you can control (down payment size, credit score, loan type selection, lender comparison shopping) from what you cannot (the federal funds rate). A 1% improvement in the rate you negotiate through excellent credit or shopping multiple lenders is within your power, and worth tens of thousands of dollars over the life of a loan. Our detailed resource on what a good credit score can do for you walks through exactly how credit scores translate to mortgage rate improvements.
For Sellers: Weighing the Lock-In Dilemma
If you hold a sub-4% mortgage and need to move, quantify the true cost of giving it up. Calculate your current payment, your projected new payment, and whether the trade-off, job opportunity, family reasons, equity extraction, justifies the ongoing monthly difference. Sometimes it clearly does. Sometimes bridge financing or renting your current home while purchasing the new one offers a better path.
For homeowners sitting on significant equity and considering tapping it, the comparison between a fixed home equity loan and a HELOC is more consequential now than at any point in the past decade. Given that the prime rate may continue to fall in 2025-2026, a HELOC could actually become more attractive than locking into a fixed home equity loan at current rates.
For Investors: Rate Cycles Create Opportunity
Real estate investors who maintain cash reserves or have access to capital at the right moment in a rate cycle can acquire properties at favorable cap rates when sentiment is negative, then refinance into lower rates as the cycle turns. The challenge is maintaining financial strength during the holding period. That means keeping a well-funded emergency reserve and understanding your carrying costs at various rate scenarios before committing to an investment property purchase.
Do not assume that because you can afford a payment at today’s rates, you can afford the same property if you use an ARM and rates rise at reset. Always stress-test your budget at the maximum possible ARM rate cap before committing to an adjustable-rate product.

When comparing lenders, request the same loan scenario, exact loan amount, term, and down payment, from at least three lenders on the same day. Rates change daily, and even a 0.25% difference in rate saves approximately $10,000 over the life of a $300,000 mortgage.
“The buyers who do best in high-rate environments are the ones who stop waiting for perfect conditions and instead optimize what they can control: their credit profile, their down payment, and their lender selection. Those three factors alone can move your effective rate by 0.5% to 1.0% in either direction.”
Real-World Example: The Torres Family’s Rate-Cycle Navigation
Marcus and Diana Torres, both 34, had been saving for their first home in the Denver metro area since 2019. By early 2022, they had $80,000 saved, enough for a 20% down payment on a $400,000 home. Their target monthly payment was $1,600, which worked comfortably at the 3.5% rates available in January 2022. Then, within six months, rates climbed to 6%. Their same target property now carried a monthly payment of $1,910–$310 more than their budget ceiling.
Rather than stretch their budget or walk away entirely, the Torres family pivoted. They widened their search radius to suburbs 25 miles from Denver where comparable homes were priced around $330,000. At 6.25%, a 30-year fixed on $264,000 (after 20% down) produced a principal-and-interest payment of $1,624, just within their budget. They accepted a slightly longer commute in exchange for a sustainable payment. They closed in October 2022.
By late 2024, with rates having dipped to approximately 6.5% on 30-year fixed loans, Marcus and Diana also evaluated refinancing their HELOC, which they had used for $15,000 in renovations at a peak rate of 9.25%, into a fixed home equity loan at 7.10%. That move reduced their HELOC payment from $116 per month to $174 per month on a 10-year amortizing schedule, but eliminated the floating-rate risk entirely. Saving towards that move was easier because they had kept their primary budget intact by not overextending on the purchase.
The Torres family’s story illustrates the central lesson of this rate environment: flexibility on the inputs you control (location, loan amount, loan type) gives you power that waiting for the perfect rate never will. By 2025, their Denver suburb home had appreciated to an estimated $395,000, giving them over $131,000 in equity, a 49% return on their $80,000 down payment in under three years.
Your Action Plan
-
Understand which of your debts are prime-rate sensitive
Audit every debt you carry and identify which ones have variable rates tied to the prime rate or SOFR. HELOCs, ARMs, and some personal loans are the most common culprits. Knowing your exposure is step one before you can manage it. For context on how the prime rate flows into other borrowing costs, see our guide on how the prime rate affects personal loan rates.
-
Check your credit score and optimize it before any major housing move
Your credit score is the single biggest factor you control in determining your mortgage rate. Moving from a 680 to a 760 score can reduce your rate by 0.5% to 0.75%. At today’s loan sizes, that is $30,000 to $50,000 in interest savings over the life of a 30-year mortgage. Pull your free credit reports at AnnualCreditReport.com, dispute any errors, and pay down revolving balances below 30% of their limits.
-
Get pre-approved by multiple lenders, not just one
Pre-approval is not binding, but it is essential for understanding your true buying power. Compare rates from at least three lenders: a large national bank, a credit union, and a mortgage broker. Brokers have access to wholesale rates and can often beat what you find shopping directly. Lock in a rate quote in writing on the same day from all lenders for a valid comparison.
-
Evaluate whether to convert variable-rate debt to fixed now or wait
If the Fed is expected to cut rates further, waiting on HELOC conversion may make sense. If rates are expected to hold or rise, converting to a fixed home equity loan protects you immediately. Review FOMC forward guidance and the CME FedWatch Tool regularly to inform this decision. The right answer depends on your HELOC balance size, your risk tolerance, and your timeline.
-
Build a robust emergency fund before purchasing or refinancing
Rate environments can shift unexpectedly. A solid three-to-six month emergency fund ensures that a job disruption or unexpected expense does not become a mortgage default scenario. For guidance on sizing your reserve, our step-by-step resource on building a six-month emergency fund walks through the process clearly.
-
Model the true cost of waiting versus buying now
Use a mortgage calculator to compare two scenarios: buying at current rates with today’s prices, versus buying 12 months from now at projected lower rates but higher prices. In many markets, a 0.5% rate drop accompanied by a 5% price increase results in a higher total cost for the waiting buyer. Run the numbers specific to your target market before making a decision based on intuition.
-
Consider rate buydowns or ARMs strategically, not as desperation moves
Temporary rate buydowns (2-1 or 3-2-1 structures) can make sense if you expect your income to grow significantly in the first few years of your mortgage. ARMs make sense if you have high certainty you will sell or refinance before the first adjustment date. Neither is inherently dangerous, but both require clear-eyed scenario planning rather than wishful thinking about future rates.
-
Monitor prime rate changes and set a refinancing trigger point
Determine your personal refinancing trigger: the rate at which refinancing makes mathematical sense given your remaining loan balance and time horizon. A common rule of thumb is to refinance when you can drop your rate by at least 0.75% and recoup closing costs within 24 months. Set up alerts through your lender or a rate-tracking service so you act at the right moment rather than missing the window.
Frequently Asked Questions
Does the prime rate directly set my mortgage rate?
Not directly, for fixed-rate mortgages. The 30-year fixed mortgage rate primarily follows the 10-year U.S. Treasury yield, which responds to many of the same economic forces that drive the prime rate, but the correlation is indirect. For adjustable-rate mortgages and HELOCs, the prime rate has a much more direct and immediate influence, often within 30 to 90 days of a Fed rate change.
How much does a 1% prime rate increase raise my HELOC payment?
On an interest-only HELOC, a 1% rate increase costs roughly $8.33 per month per $10,000 of outstanding balance. So a $50,000 HELOC balance becomes $41.65 per month more expensive with each 1% rate hike. A 5% cumulative increase on that same balance adds $208 per month, over $2,500 per year, to your carrying costs.
Will falling rates cause home prices to drop?
Historically, falling rates tend to support or increase prices rather than reduce them. Lower rates expand the pool of qualified buyers, increasing competition for available inventory. Unless supply increases dramatically at the same time, which is unlikely given current construction constraints, falling rates typically drive prices upward. Buyers who wait for both lower rates and lower prices may be waiting indefinitely.
What is the lock-in effect and how long will it last?
The lock-in effect refers to existing homeowners’ reluctance to sell because doing so would require trading their below-market mortgage rate for a much higher current market rate. It began in earnest in 2022 and suppressed inventory significantly through 2024. As rates gradually decline toward the 5-6% range over 2025-2027, economists expect the lock-in effect to gradually ease as the rate penalty for moving becomes smaller.
Is this a good time to buy a home given the prime rate environment?
There is no universally right answer, it depends on your personal financial situation, job stability, local market conditions, and how long you plan to stay in the home. If you plan to stay at least 5-7 years, have a solid down payment, stable income, and can afford the payment at current rates without strain, buying now may make sense even if rates are above historical averages. The risk of waiting is that prices rise faster than rates fall.
How does the prime rate affect new home construction?
Rising prime rates increase builders’ construction financing costs directly, since most construction loans carry variable rates pegged to prime. This reduces builder profit margins and incentivizes scale-backs in new projects. It also reduces the pool of qualified buyers for completed homes. Both effects constrain new supply, which is one reason housing shortages persist even during rate-driven demand slowdowns.
What is a mortgage rate buydown and when does it make sense?
A rate buydown is an upfront payment, made by the buyer, seller, or builder, that temporarily or permanently reduces the mortgage interest rate. A 2-1 buydown reduces the rate by 2% in year one and 1% in year two before settling at the contract rate in year three. It makes sense when you expect your income to grow in the early years of your mortgage, or when sellers offer it as an incentive to close a deal in a slow market. Always calculate whether the upfront cost is recovered in payment savings before year three.
How does the prime rate affect home equity in a downturn?
When rising prime rates compress buyer demand and reduce transaction volume, home value appreciation typically slows. If prices decline, homeowners’ equity falls proportionally. Equity is also built through principal paydown on your existing mortgage, however, which continues regardless of market conditions. Homeowners with substantial equity cushions are far less vulnerable to rate-driven price corrections than those who bought recently with minimal down payments.
Should I pay points to lower my mortgage rate?
Paying discount points (each point equals 1% of the loan amount and typically reduces your rate by 0.25%) makes mathematical sense only if you remain in the loan long enough to recoup the upfront cost in monthly savings. Divide the cost of the points by the monthly payment reduction to find your breakeven period. If you plan to refinance or sell within that window, paying points likely is not worth it.
How can I protect my finances from future prime rate increases?
The most effective protections are: converting variable-rate debt (HELOCs, ARMs) to fixed-rate products when rates are manageable; building a substantial emergency fund to absorb payment shocks; and keeping your total housing cost below 28% of gross income so you have buffer room. On the asset side, higher prime rates mean better yields on savings vehicles, understanding what happens to your savings when the prime rate rises can help you take advantage of the upside of higher rates.
Sources
- Federal Reserve, H.15 Selected Interest Rates (Prime Rate Historical Data)
- National Association of Realtors, Existing Home Sales Statistics
- Federal Reserve, 2023 Survey of Consumer Finances
- Freddie Mac, Primary Mortgage Market Survey (PMMS)
- NAHB, Housing Market Index (Builder Confidence)
- Federal Reserve Bank of New York, Household Debt and Credit Report
- Mortgage Bankers Association, Weekly Mortgage Applications Survey
- U.S. Census Bureau, New Residential Construction Statistics
- Federal Reserve, FOMC Meeting Calendar and Policy Decisions
- D.R. Horton, Annual Report and Investor Relations (Builder Incentive Data)
- Consumer Financial Protection Bureau, Explore Interest Rates Tool