Fact-checked by the Prime Rate editorial team
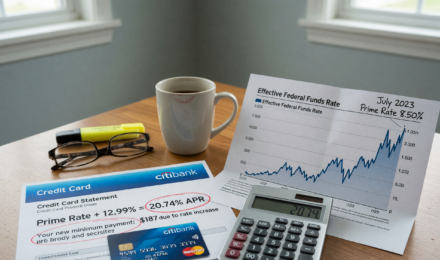
If you took out a home equity line of credit, a variable-rate personal loan, or carried a credit card balance between 2022 and 2023, you felt it viscerally: your minimum payment climbed month after month, seemingly without end. The prime rate peak cycle that culminated in July 2023 pushed the U.S. prime rate to 8.50%, a level not seen since January 2001. For millions of American borrowers, that translated into hundreds of extra dollars in annual interest charges, often with little warning and almost no time to prepare.
The Federal Reserve raised the federal funds rate 11 times between March 2022 and July 2023, a cumulative increase of 525 basis points, the fastest tightening cycle in four decades. According to the Federal Reserve’s H.15 release, the prime rate moved in lockstep with each hike, since it is set at exactly 300 basis points above the federal funds rate target. Outstanding credit card balances in the U.S. surpassed $1 trillion for the first time in mid-2023, while average credit card APRs climbed above 22%, per Consumer Financial Protection Bureau data. The financial pressure on households was not abstract, it was measurable, compounding, and real.
This guide dissects exactly how the prime rate behaves at the peak of a rate cycle: what signals it sends, how long peaks historically last, which debt instruments suffer most, and which financial products actually reward patient savers. You will walk away with a concrete framework for reading the economic signals, protecting existing debt, and positioning your money to benefit when the cycle eventually turns.
Key Takeaways
- The prime rate peaked at 8.50% in July 2023, its highest level since 2001, after 11 consecutive Federal Reserve rate hikes totaling 525 basis points over 16 months.
- Historical peak cycles last an average of 6 to 15 months before the first rate cut, giving borrowers a defined window to refinance or restructure debt.
- A borrower carrying $25,000 in variable-rate debt at 8.50% prime pays roughly $2,125 per year in interest, compared to $1,125 per year at the pre-hike rate of 3.25% in early 2022.
- High-yield savings accounts and CDs offered APYs above 5.00% during the 2023 peak, the best yields for savers since 2007.
- Credit card APRs, which averaged just 14.6% in early 2022, exceeded 22% by mid-2023, adding an estimated $1,000+ per year in interest for the average cardholder carrying a balance.
- The Fed held rates steady for 14 months (July 2023 to September 2024) before beginning its first cut cycle, a plateau phase that rewarded locked-in CD holders and penalized variable-rate borrowers equally.
In This Guide
- What Defines a Prime Rate Peak?
- Historical Prime Rate Peak Cycles: A Data Review
- How the Fed Signals a Rate Peak
- Which Debt Products Are Hit Hardest at the Peak?
- Where Savers Win During a Prime Rate Peak
- The Plateau Phase: How Long Does the Peak Last?
- Key Economic Indicators to Watch at the Peak
- Transitioning From Peak to Rate Cuts: What Changes First
- Borrower Strategies for the Peak and Beyond
- Saver and Investor Strategies at the Peak
What Defines a Prime Rate Peak?
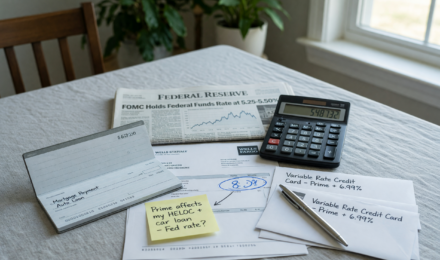
A prime rate peak occurs when the Federal Reserve stops raising the federal funds rate and holds it at its cycle-high level. Because the prime rate is set mechanically at 300 basis points above the fed funds target, it peaks simultaneously and holds at that ceiling until the Fed votes to cut.
The peak is not a single day. It is a sustained period of maximum rate pressure. During this plateau, every variable-rate financial product tied to the prime rate remains at its most expensive. Borrowers who took out adjustable-rate mortgages, HELOCs, or variable-rate personal loans during lower-rate periods feel the full weight of the accumulated hikes.
The Mechanical Link Between Fed Policy and Prime Rate
The prime rate does not fluctuate independently. Major U.S. banks set their prime rate in direct response to Federal Open Market Committee (FOMC) decisions. When the FOMC raises the federal funds target by 25 basis points, the prime rate rises by exactly 25 basis points, typically within 24 hours of the announcement.
This mechanical relationship means the prime rate peak is defined entirely by Fed policy. Understanding Fed behavior, not bank behavior, is the key to anticipating when a peak has arrived and how long it will last.
The prime rate has moved in perfect lockstep with the federal funds rate since the 1990s. Every one of the Fed’s 11 rate hikes between March 2022 and July 2023 produced an identical same-day increase in the U.S. prime rate.
Peak vs. Plateau: An Important Distinction
Analysts often conflate the peak with the plateau. The peak is the specific rate level reached at the top of the cycle. The plateau is the duration for which that peak rate is maintained. In 2023–2024, the Fed peaked at 5.25%–5.50% (funds rate) in July 2023 and held that level through September 2024, a plateau of 14 months.
For borrowers, the plateau can be more damaging than the peak itself. Each additional month at the maximum rate compounds interest charges on outstanding balances. For savers, the plateau is an extended opportunity to lock in high yields.
One honest caveat worth stating plainly: this framework is most useful for borrowers and savers who have time to act and some financial flexibility. Someone carrying $30,000 in credit card debt with no savings cushion cannot easily execute balance transfers, convert HELOCs, or lock up cash in CDs. The strategies in this guide assume at least a modest degree of financial stability. For households in genuine financial distress during a rate peak, the priority should be stabilizing cash flow first, not optimizing yield.
Historical Prime Rate Peak Cycles: A Data Review
Studying past prime rate peak cycles reveals consistent patterns in duration, economic context, and market response. The Fed does not operate in a vacuum, each tightening cycle reflects specific inflationary pressures and resolves when those pressures ease sufficiently.
| Rate Cycle Peak Period | Prime Rate Peak | Plateau Duration | Trigger for First Cut |
|---|---|---|---|
| 1980–1981 | 21.50% | ~2 months | Rapid inflation decline |
| 1989–1990 | 11.50% | ~7 months | Recession onset |
| 1994–1995 | 9.00% | ~6 months | Soft landing achieved |
| 1999–2000 | 9.50% | ~8 months | Dot-com bust, recession |
| 2006–2007 | 8.25% | ~14 months | Housing market collapse |
| 2018–2019 | 5.50% | ~7 months | Trade war slowdown |
| 2023–2024 | 8.50% | 14 months | Inflation returned to ~2.5% |
The data above, drawn from Federal Reserve Bank of St. Louis FRED data on the prime rate, reveals that plateau durations typically range from 6 to 14 months. The 2023–2024 cycle matched the longest plateaus on record.
Lessons From the 2006–2007 Peak
The 2006–2007 plateau is particularly instructive. Holding at 8.25% from June 2006 through September 2007–15 months, adjustable-rate mortgage resets were silently accumulating during that window, creating the pressure that would eventually contribute to the 2008 financial crisis.
Borrowers who refinanced into fixed-rate mortgages during that plateau window avoided the worst of the eventual rate collapse and credit tightening. Those who waited saw both their rates reset higher and their home values collapse simultaneously.
During the 2006–2007 prime rate plateau at 8.25%, approximately 1.7 million adjustable-rate mortgages were scheduled to reset to higher rates, a figure cited by the U.S. Treasury in its 2007 financial stability report as a key systemic risk.
The Rare “Quick Turn” Cycles
Extended plateaus are the norm, but not the rule. In 1980–1981, the prime rate peaked at an extraordinary 21.50% but held there for only about two months before the Fed began cutting aggressively. The rapid inflation decline under Chairman Paul Volcker made a prolonged plateau unnecessary.
Quick-turn cycles favor borrowers but often punish savers who locked into shorter-term instruments expecting yields to persist. Understanding which type of cycle you are in, prolonged plateau or quick turn, dramatically changes the optimal financial strategy.
How the Fed Signals a Rate Peak
The Federal Reserve does not announce “we have reached the peak.” Instead, it communicates through a carefully curated language of statements, press conferences, and economic projections. Learning to read these signals gives you weeks or months of advance notice.
The Language Shift in FOMC Statements
FOMC statements are parsed by every major financial institution for subtle wording changes. The shift from “ongoing increases” to “some additional policy firming may be appropriate” to “holding steady” marks the progression toward a peak. When the statement removes forward guidance entirely and replaces it with data-dependency language, the peak is likely near or already reached.
In May 2023, the FOMC statement dropped the phrase “ongoing increases”, a widely noted signal that the hiking cycle was approaching its end. The final hike occurred in July 2023, confirming what the language had telegraphed two meetings earlier.
According to Federal Reserve Chair Jerome H. Powell’s May 2023 press conference, the Fed’s dot plot and meeting minutes serve as the primary mechanism by which the central bank communicates its rate trajectory to markets months in advance. That forward guidance is not incidental, it is deliberate policy communication, and attentive borrowers and investors should treat every FOMC meeting as a potential turning point.
The Dot Plot and Rate Projections
The dot plot, formally the Summary of Economic Projections, shows where each FOMC member expects the federal funds rate to be at year-end for the next three years. When the median dot stops moving higher between meetings, it is a strong confirmation that the Fed views itself as at or near the peak.
In June 2023, the median dot held at 5.1% for year-end 2023, exactly where rates already were. That near-stasis in the dot plot, combined with shifting FOMC language, gave sophisticated observers a clear read that July 2023 would be the last hike of the cycle.
Inflation Data as the Trigger
The Fed’s decision to hold at the peak is driven by inflation data. The Fed targets 2% core PCE inflation. When inflation readings begin declining consistently, even if still above target, the Fed can justify a pause. In the 2022–2023 cycle, core PCE peaked at 5.6% in February 2023 and fell to approximately 3.9% by the time of the final July 2023 hike, providing cover for the pause.

Which Debt Products Are Hit Hardest at the Peak?
Debt products do not respond to a prime rate peak cycle equally. The severity of impact depends on whether the rate is variable or fixed, how directly the product is tied to the prime rate, and the outstanding balance carried. Understanding this hierarchy helps borrowers prioritize which debt to address first.
| Debt Product | Rate Basis | Avg Rate at 2023 Peak | Impact Severity |
|---|---|---|---|
| Credit Cards | Prime + margin (up to 15%) | 22.77% avg APR | Very High |
| HELOC | Prime + small margin | 8.90%–9.50% | High |
| Variable Personal Loans | Prime + 3%–7% | 11.50%–15.50% | High |
| Adjustable-Rate Mortgages | Index + margin (annual reset) | 7.50%–8.50% | Moderate–High |
| Fixed-Rate Mortgages | Not tied to prime | No change on existing loans | None (existing) |
| Federal Student Loans | Fixed at origination | No change on existing | None (existing) |
Credit Cards: The Most Exposed Product
Credit cards are the single most exposed consumer debt product at the peak of a rate cycle. Their rates adjust almost immediately following each FOMC hike, with no lag. A card carrying a $10,000 balance at 22.77% APR generates approximately $2,277 in annual interest, compared to $1,460 at the pre-cycle average of 14.6% in early 2022. That is an extra $817 per year in interest on a single card.
Understanding how the prime rate affects your credit card interest rates is essential context here. The margin banks add above prime has also widened over the past decade, meaning the effective penalty for carrying a balance has grown independently of Fed policy.
Many balance transfer promotional offers expire during extended rate plateaus. If you transferred a balance to a 0% APR card in 2022 and the promotional period ends during a prime rate peak, the go-to rate could be 24% or higher, erasing months of debt reduction progress in a single billing cycle.
HELOCs and Variable Home Equity Products
A home equity line of credit (HELOC) is typically priced at prime plus a margin of 0%–2%, making it one of the most directly prime-linked products. At 8.50% prime with a 0.50% margin, a $50,000 HELOC at 9.00% generates $4,500 in annual interest, more than double the $1,875 it generated when prime was 3.25% in early 2022.
For a deeper look at how the prime rate affects your mortgage and home equity loan, including refinancing strategies, that resource covers the full spectrum of home-secured debt behavior across rate cycles.
Where Savers Win During a Prime Rate Peak
While borrowers absorb maximum interest costs at the prime rate peak, savers enjoy the best yield environment in years. The same rate environment that punishes variable-rate debt rewards depositors and fixed-income investors who know where to look.
High-Yield Savings Accounts
Online banks and credit unions moved quickly to pass through Fed rate hikes to savings accounts. By mid-2023, the top high-yield savings accounts were offering APYs of 5.00%–5.25%, compared to the national average of just 0.40% at traditional banks. A $50,000 emergency fund in a high-yield savings account at 5.15% generated $2,575 in annual interest, free money for doing nothing more than switching banks.
If you have not already made the switch, reviewing the best high-yield savings accounts for 2026 is a logical next step, particularly as rates remain elevated relative to historical averages even after initial Fed cuts.
In July 2023, the top 10 online high-yield savings accounts averaged 5.07% APY, a 23-fold increase from the 0.22% national average offered in January 2022, per FDIC data. That gap represented one of the largest divergences between online and traditional bank savings rates on record.
Certificates of Deposit at the Peak
CDs are particularly powerful tools at a rate peak. By locking in a high APY before the Fed begins cutting, savers can guarantee elevated returns for 12, 24, or even 60 months. During the 2023 peak, 1-year CDs crossed 5.50% at several major online banks, the best 12-month CD rates in 16 years.
The strategic logic of building a CD ladder during a peak cycle is compelling: stagger maturities across 3-, 6-, 12-, and 24-month terms to maintain liquidity while capturing high yields at multiple points on the curve. This approach also hedges against uncertainty about when cuts will begin.
Money Market Accounts and Funds
Money market accounts at online banks tracked the prime rate closely. At the 2023 peak, top money market accounts offered 5.00%–5.15% APY with full FDIC insurance and next-day liquidity, a combination unavailable at any prior point in recent memory. Government money market funds briefly exceeded 5.40% yields.
At the peak of a rate cycle, use a combination of high-yield savings for near-term liquidity and 12-to-18-month CDs for slightly higher locked yields. This barbell approach captures both flexibility and rate certainty before the Fed begins cutting.

The Plateau Phase: How Long Does the Peak Last?
The plateau phase, the period between the final rate hike and the first rate cut, is arguably the most strategically important window of the entire cycle. It is a defined period of maximum borrowing cost and maximum saving yield that will not last indefinitely.
What Determines Plateau Length
Three primary factors determine how long the Fed maintains its peak rate: inflation trajectory, labor market data, and financial system stability. A rapid decline in inflation, as seen in 1980–1981, shortens the plateau dramatically. Stubborn inflation, as in 2023–2024, extends it to over a year.
The Fed’s dual mandate (maximum employment and price stability) means it will not cut unless inflation shows sustained progress toward 2% without triggering unacceptable unemployment. In 2024, unemployment remained historically low even as inflation declined, giving the Fed room to hold rates longer than many analysts expected.
Market Expectations vs. Fed Behavior
Financial markets notoriously overestimate the pace of rate cuts during the plateau. In early 2024, fed funds futures markets priced in six to seven rate cuts for the year. The Fed delivered three cuts totaling 100 basis points, beginning in September 2024 and ending in December 2024. That gap between market expectations and Fed reality created significant volatility in bond markets throughout 2024.
The pattern is consistent across prior cycles: markets habitually price in more cuts than the Fed delivers at the start of each easing cycle. The 2024 experience, investors expecting six cuts and getting three, matches every prior cycle since the 1990s, according to analysis by KPMG Chief Economist Diane Swonk. Borrowers who plan around market expectations rather than Fed signals tend to make expensive mistakes.
Behavior of Long-Term Rates During the Plateau
Long-term rates, like the 30-year mortgage rate, do not necessarily move in lockstep with the prime rate during the plateau. In 2024, 30-year mortgage rates actually rose from 6.6% in January to over 7.2% in April, even as the prime rate held flat, because the bond market was repricing the expected path of Fed cuts. This divergence is why borrowers cannot rely solely on watching the prime rate.
Key Economic Indicators to Watch at the Peak
Navigating a prime rate peak cycle effectively requires watching a short list of high-signal economic indicators. These are the data points the Fed watches most closely, and the ones that will signal when the cycle is about to turn.
| Indicator | What to Watch For | Significance |
|---|---|---|
| Core PCE Inflation | Sustained decline toward 2.5%–3.0% | Fed’s preferred inflation measure, most direct trigger |
| CPI (Month-over-Month) | Three consecutive prints below 0.3% | Signals inflation momentum is breaking |
| Unemployment Rate | Rise above 4.5% (from cycle lows) | Signals labor market softening; pressures Fed to cut |
| JOLTS Job Openings | Sustained decline in openings-to-unemployed ratio | Leading indicator of wage pressure easing |
| Retail Sales (Real) | Two or more months of negative readings | Consumer spending weakening; deflationary pressure |
| Fed Dot Plot (Median) | Dots shifting lower for current year | Direct signal of FOMC rate cut intentions |
Leading vs. Lagging Indicators at the Peak
Some indicators are more useful than others. Leading indicators, like the yield curve, JOLTS data, and ISM manufacturing PMI, tend to signal turning points weeks or months before lagging indicators like the unemployment rate confirm them. At the 2023–2024 peak, the yield curve had been deeply inverted since mid-2022, a historically reliable recession predictor that extended the caution of investors well into the plateau period.
Credit Market Signals
Credit spreads, the difference between Treasury yields and corporate bond yields, also provide important signals. When investment-grade spreads widen above 150 basis points or high-yield spreads exceed 500 basis points during a plateau, it suggests financial stress is building and the Fed may be forced to cut sooner than planned. Monitoring credit spreads through resources like the ICE BofA Corporate Bond spread on FRED adds an important dimension to the analysis.
The U.S. Treasury yield curve has inverted (with 2-year yields exceeding 10-year yields) before every recession since 1955, with only one false signal. During the 2022–2024 rate cycle, the 2s/10s curve inverted by as much as 108 basis points, the deepest inversion since 1981.
Transitioning From Peak to Rate Cuts: What Changes First
The transition from a rate peak to an easing cycle does not happen all at once. Different financial products respond to the first rate cut with very different speeds and magnitudes. Understanding this sequence helps you time financial decisions more precisely.
What Moves Immediately
The prime rate drops within 24 hours of the first Fed cut, exactly as it rises with each hike. Variable-rate products tied directly to prime (HELOCs, most credit cards) see their rates adjust in the next billing cycle. A 25-basis-point cut on a $30,000 HELOC saves approximately $75 per year in interest, modest in isolation, but meaningful across multiple cuts.
Money market fund yields and high-yield savings APYs also begin declining almost immediately after the first cut. Banks that compete aggressively on savings rates during the hiking cycle tend to lower them just as quickly when the direction reverses.
What Moves Slowly
Long-term fixed rates, particularly 30-year mortgage rates, respond to Fed cuts with a significant lag and only partially. The 30-year mortgage rate is priced off the 10-year Treasury yield, not the federal funds rate. After the Fed’s first cut in September 2024, mortgage rates actually rose slightly before declining. This disconnect frustrates borrowers expecting immediate relief and surprises savers accustomed to thinking all rates move together.
The CD Opportunity Window Closes
The most time-sensitive transition for savers: CD rates drop quickly once cuts begin. Banks price new CDs based on expected future fed funds rates, not current ones. By the time the Fed has announced two or three cuts, 12-month CD rates may have already declined 50–75 basis points from their peak. The window to lock in peak yields is front-loaded, often closing before the headline rate has moved much at all. Reviewing the best CD rates for 2026 can help you assess what remains available as the cycle continues to evolve.

Borrower Strategies for the Peak and Beyond
A prime rate peak cycle demands specific, sequenced action from borrowers, not generic advice about paying down debt. The goal is to reduce exposure to variable rates during the plateau and position for relief when cuts begin.
Prioritizing Variable-Rate Debt
At the peak, your highest-priority payoff targets are variable-rate, high-balance debts, particularly credit cards and HELOCs. A debt avalanche approach (paying off the highest interest rate first) is mathematically optimal and especially powerful during a plateau. A structured plan to pay off debt using the avalanche method could save thousands in interest over a 12-to-18-month plateau period.
Fixed-Rate Conversion Opportunities
The plateau phase, when rates are high but stable, is an attractive window to convert variable-rate debt to fixed. A HELOC with a $75,000 balance can often be converted into a fixed-rate home equity loan. While the fixed rate may be similar to the current variable rate, it provides certainty and protection against future rate surprises, in either direction.
Refinancing into a fixed-rate loan during a plateau locks in today’s elevated rates. If the Fed cuts aggressively over the next 12 to 18 months, you could find yourself stuck in a higher-rate instrument while peers with variable rates enjoy automatic relief. Run the break-even analysis before committing to any conversion.
Personal Loan Refinancing
Variable-rate personal loans are candidates for refinancing into fixed-rate alternatives during the plateau. For those working through how the prime rate affects personal loan rates, the practical steps include checking whether your current lender offers rate modifications, comparing fixed-rate offers from at least three lenders, and calculating the total cost of the loan under both scenarios using the full expected plateau duration.
Saver and Investor Strategies at the Peak
For savers and investors, a prime rate peak cycle is an opportunity, but only if acted upon before the Fed begins cutting. The strategic priorities shift meaningfully depending on your time horizon and risk tolerance.
Locking In Yields Before They Fall
The single most impactful action for a saver at the peak is locking in high yields through CDs or Treasury bills before the Fed begins cutting. A 24-month CD purchased at 4.85% APY in mid-2024 guaranteed that yield through mid-2026, well past the period when money market and savings account rates had already declined to 4.00% or below.
Comparing CD rates versus high-yield savings accounts across multiple institutions and terms is the foundational step in this process. The right allocation depends on when you need liquidity and how confident you are in the plateau’s duration.
Treasury Bills and I-Bonds
Short-term Treasury bills (4-week to 52-week) also hit attractive yields during the 2023 peak, with 6-month T-bills yielding 5.50%+, fully backed by the U.S. government and exempt from state and local income tax. For investors in high-tax states, the after-tax yield on T-bills exceeded the after-tax yield on even the best savings accounts.
Series I savings bonds issued between November 2022 and April 2023 carried a composite rate of 6.89%, the highest I-bond rate since 1998. While the I-bond rate has since declined, the 2022–2023 rate cycle created a brief but historically rare opportunity for risk-free inflation-adjusted returns.
Investment Positioning at the Peak
Equity investors should note that the stock market does not consistently decline at rate peaks. The S&P 500 gained approximately 24% between the July 2023 rate peak and December 2024, even as rates held at cycle highs. Rate peaks signal restrictive policy, but they also often coincide with moderating inflation and resilient earnings, which are equity-positive factors. The more important equity risk is in highly leveraged companies with floating-rate debt, which face sustained margin compression during a prolonged plateau.
Mohamed El-Erian, President of Queens’ College Cambridge and former PIMCO CEO, has argued publicly that the intuitive assumption of equity suffering at rate peaks consistently underestimates the market’s forward-looking nature. By the time the Fed stops hiking, much of the tightening impact is already priced in, and attention turns to when, not if, cuts are coming. That framing has been borne out by the 2023–2024 equity performance data.
Real-World Example: How Sarah Navigated the 2023 Prime Rate Peak
Sarah, a 41-year-old marketing manager in Austin, Texas, entered 2023 with $18,000 in credit card debt at a variable APR of 22.5%, a $55,000 HELOC balance at 9.0%, and $40,000 sitting in a traditional bank savings account earning 0.15% APY. Her total annual interest burden was approximately $9,060, and her savings account was generating just $60 per year.
In March 2023, Sarah recognized the rate environment had reached a plateau. She took three targeted actions: she transferred $12,000 of her credit card balance to a 21-month 0% APR balance transfer card, eliminating $2,700 in annual interest on that portion. She moved her $40,000 savings to an online high-yield savings account at 4.95% APY, immediately generating $1,980 per year instead of $60. And she used $6,000 from savings to make a lump-sum payment on her HELOC, reducing the balance to $49,000 and cutting her HELOC interest by $540 annually.
When the promotional balance transfer period ended in December 2024, the prime rate had already fallen from 8.50% to 7.50%, pulling her remaining credit card go-to rate down with it. Her HELOC rate had declined by 100 basis points to 8.0%, saving her another $490 per year on the remaining balance. Total annualized interest savings from her three actions: approximately $4,770, without refinancing her home or taking on any new risk.
The most important part of Sarah’s story: she acted during the plateau, not at the peak or after the first cut. The balance transfer offer she used expired in April 2023. The 4.95% savings APY she locked into was available for 14 months before the bank began repricing deposits downward in late 2024. Timing the plateau, not just identifying the peak, was what made the difference.
Your Action Plan
-
Identify every variable-rate debt you carry
List all outstanding balances with their current rates, minimum payments, and rate structure (variable vs. fixed). Rank by annual interest cost, this is your priority attack list during any prime rate peak cycle plateau.
-
Check your credit card APRs and compare balance transfer options
During a rate plateau, balance transfer offers with 0% promotional periods are among the most powerful debt-reduction tools available. The best offers provide 15–21 months of 0% APR for a one-time fee of 3%–5%. On a $15,000 balance at 22% APR, that fee pays for itself in under four months.
-
Move idle savings out of traditional bank accounts immediately
A traditional savings account earning 0.40% when high-yield alternatives offer 4.50%+ is a silent tax on your emergency fund. Even during the post-peak period, online banks and credit unions continue to offer significantly higher yields than the national average.
-
Evaluate whether to lock in CD yields before further cuts
If the Fed has begun cutting rates, CD yields may already be declining. Compare 12-month, 18-month, and 24-month CD rates across at least three institutions. Calculate the total interest earned under each scenario to determine whether the lock-in benefit outweighs the flexibility cost.
-
Review your HELOC and consider conversion or accelerated payoff
If your HELOC balance is significant and you have 12 months or more of remaining draw period, explore conversion to a fixed-rate home equity loan. If you expect the Fed to cut aggressively, consider maintaining the variable rate and benefiting from automatic payment reductions.
-
Watch for the first rate cut and prepare to refinance if appropriate
The first Fed cut is not necessarily the right moment to refinance a mortgage or personal loan. Wait for two to three cuts and assess where fixed rates have actually moved, not just the prime rate. Mortgage rates, in particular, may not respond proportionally to Fed cuts.
-
Build or maintain a fully-funded emergency fund in a high-yield account
Rate peaks create the rare environment where your emergency fund generates meaningful returns without any risk. A 3-to-6-month emergency fund in a high-yield savings account earning 4.50% earns $1,350–$2,700 per year on a $30,000–$60,000 balance, an incentive to keep the fund fully funded. Building an emergency fund step by step is a foundational move regardless of the rate cycle.
-
Revisit your overall budget to free up cash for debt payoff or savings
A structured monthly budget directly amplifies the impact of every other action in this plan. Identifying $200–$400 per month in discretionary spending that can be redirected to debt payoff or additional CD contributions could produce $2,400–$4,800 more in annual debt reduction or savings during the plateau window.
Frequently Asked Questions
How high has the prime rate historically peaked?
The highest prime rate in U.S. history was 21.50%, reached in December 1980 under Federal Reserve Chairman Paul Volcker during his aggressive campaign to break the inflation of the late 1970s. More recent peaks include 9.50% in 2000, 8.25% in 2006–2007, and 8.50% in 2023. Each peak reflects the severity of the inflationary episode preceding it.
How long does the prime rate typically stay at its peak?
Historical data shows plateaus ranging from approximately 2 months (1980–1981) to 15 months (2006–2007). The 2023–2024 plateau lasted exactly 14 months, from July 2023 to September 2024. The median plateau across the last seven major cycles is approximately 7–8 months.
Does the stock market go down when the prime rate peaks?
Not reliably. The 2023 peak period saw the S&P 500 gain roughly 24% through the subsequent 17 months. Historically, equities have risen during rate pauses as inflation moderates and earnings remain resilient. The bigger equity risk is in the tightening cycle itself, markets often sell off during aggressive hiking phases, not at the peak.
What happens to my credit card rate after the Fed cuts?
Credit card rates tied to the prime rate decline in the billing cycle following a Fed cut, but only by the amount of the cut. A 25-basis-point cut reduces a variable APR of 22.77% to 22.52%. The impact on a minimum payment is modest on its own. Multiple cuts of 25 basis points each are needed to produce material relief, and the bank’s margin above prime is unaffected by Fed policy.
Should I pay off debt or save money at the peak?
Pay off debt whose interest rate exceeds your highest available savings yield. At the 2023 peak, a credit card at 22% APR should have been the priority over a savings account earning 5%. However, maintaining at least a partial emergency fund is important for financial stability, a hybrid approach (partial debt payoff, partial savings) is reasonable for most households.
Are fixed-rate mortgages affected by the prime rate peak?
Existing fixed-rate mortgages are entirely unaffected by prime rate changes, your rate is locked in at origination. New fixed-rate mortgages are influenced by the 10-year Treasury yield, not directly by the prime rate. In 2023–2024, new 30-year mortgage rates were in the 7%–8% range, but this was a function of Treasury yields, not the prime rate itself.
When is the right time to lock in a CD at the peak?
Lock in CD yields during the late hiking phase or early plateau, before markets have priced in imminent cuts. By the time the first cut is announced, many banks have already begun reducing their offered CD rates in anticipation. Locking in 12-to-24-month CDs approximately 1–3 months before the expected first cut tends to capture the best available yields.
How do I know if the prime rate has truly peaked?
Watch for three confirming signals simultaneously: the FOMC statement removes forward guidance about future hikes; the median dot plot holds steady rather than moving higher; and core PCE inflation shows sustained multi-month declines toward the 2.5%–3.0% range. Any two of three signals present a strong case for the peak; all three together is a high-confidence signal.
What is the best debt to pay off first at a rate peak?
Rank debts by their annual interest cost (balance multiplied by APR). For most consumers, credit cards, often carrying balances at 20%–24% APR, represent the highest-cost debt and should be targeted first. HELOCs and variable personal loans come next. Fixed-rate student loans and mortgages, regardless of balance, should be last on the list in any rate environment.
Does the prime rate peak affect small business lending?
Significantly. Most small business lines of credit and SBA loans are priced at prime plus a margin, often ranging from prime + 1% to prime + 4%. At the 2023 peak of 8.50%, a small business line of credit at prime + 2% cost 10.50%, more than double the equivalent cost in early 2022. This elevated rate environment contributed to a documented slowdown in small business borrowing and investment throughout 2023 and into 2024.
Is a CD ladder a good strategy if you might need the money early?
No, not without modification. CDs impose early withdrawal penalties, typically 90 to 180 days of interest on shorter terms, and up to 12 months of interest on longer ones. If there is a meaningful chance you will need funds before a CD matures, a high-yield savings account offers better liquidity at only a modest yield cost. CD ladders are best suited to savers who have a separate emergency fund already in place and can genuinely afford to leave the laddered funds untouched.
Can you still benefit from a rate peak if you missed the highest CD yields?
Yes, though less so. Once the Fed begins cutting, new CD rates decline, but they typically remain above long-run averages for several months into an easing cycle. If you missed the absolute peak, locking in a 12-month CD at 4.25% is still materially better than leaving funds in a traditional savings account at 0.40%. The window narrows with each subsequent cut, so acting sooner captures more of the remaining rate advantage.
Sources
- Federal Reserve, H.15 Selected Interest Rates (Prime Rate Historical Data)
- Federal Reserve Bank of St. Louis FRED, U.S. Bank Prime Loan Rate
- Consumer Financial Protection Bureau, Consumer Credit Trends
- Federal Reserve, FOMC Meeting Calendars and Statements
- Federal Reserve Bank of St. Louis FRED, ICE BofA US Corporate Bond Option-Adjusted Spread
- U.S. Bureau of Labor Statistics, Consumer Price Index Data
- U.S. Bureau of Economic Analysis, Personal Consumption Expenditures Price Index
- Federal Reserve Bank of St. Louis FRED, 10-Year to 2-Year Treasury Yield Spread
- Federal Reserve Bank of St. Louis FRED, Effective Federal Funds Rate
- Federal Reserve, Historical FOMC Materials and Transcripts
- Federal Reserve Bank of New York, Current Issues in Economics and Finance