Fact-checked by the Prime Rate editorial team
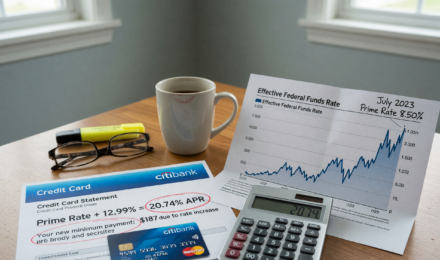
Interest rates have been completely still for over a year. The prime rate has sat at 7.50% through eight consecutive FOMC meetings with no change, a rare stretch of monetary inertia that has quietly reshaped borrowing costs, savings yields, and investment decisions for millions of Americans. The flat prime rate signal is more than a curiosity. It’s a data point that economists, lenders, and smart personal finance consumers should be actively reading.
Consider the stakes. The prime rate directly influences the interest rates on approximately $1.3 trillion in outstanding credit card balances, according to the Federal Reserve’s Consumer Credit report. It also ripples into home equity lines of credit (HELOCs), variable-rate personal loans, and small business lending. When that rate stays frozen for 12 consecutive months, it creates a prolonged period of financial stasis, one that rewards the informed and quietly punishes those who aren’t paying attention.
This article breaks down exactly what a 12-month flat prime rate period signals about the broader economy. You’ll learn how to decode the Fed’s inaction, understand which financial products it affects most, and take concrete steps to position yourself strategically, whether you’re a borrower, saver, or investor.
Key Takeaways
- The prime rate has held at 7.50% for over 12 months, its longest flat stretch since the post-2008 recovery period.
- A sustained flat prime rate typically signals that the Fed believes inflation is under control, core PCE inflation fell to approximately 2.6% by late 2025, near the Fed’s 2% target.
- Credit card APRs remain elevated near 21–22% on average, meaning a 12-month flat rate does NOT automatically lower your borrowing costs.
- High-yield savings accounts and CDs have delivered 4.5–5.2% APY during the flat rate period, windows that may close within 6–12 months if cuts begin.
- Historically, a 12-month rate freeze has preceded a rate-cutting cycle within 6–18 months in 4 of the last 5 comparable periods since 1990.
- HELOC borrowers with $50,000 balances have saved roughly $0 in new interest during this freeze, but face meaningful payment changes if the prime rate drops by even 0.50%.
In This Guide
- What a Flat Prime Rate Actually Means
- Historical Flat Rate Periods: What the Data Shows
- What the Fed’s Inaction Is Really Telling You
- The Inflation Connection: Why Stability Matters
- How a Flat Prime Rate Affects Borrowers
- What Savers and Investors Should Know
- Effects on the Housing Market
- What It Signals for Business Lending and the Job Market
- What Comes Next: Reading the Forward Signals
What a Flat Prime Rate Actually Means
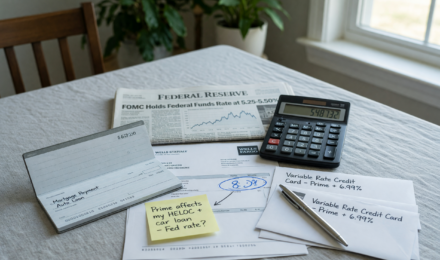
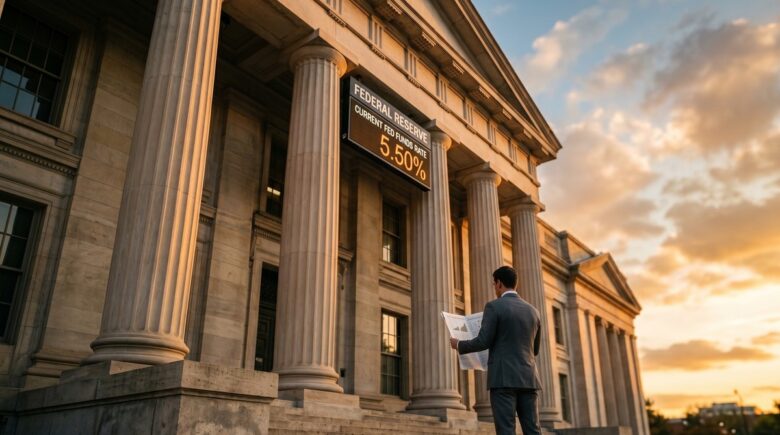
The prime rate is the benchmark interest rate that U.S. commercial banks charge their most creditworthy customers. It is set at 3 percentage points above the federal funds rate target, which is controlled by the Federal Open Market Committee (FOMC). When the Fed moves its target rate, the prime rate moves in lockstep.
Twelve consecutive months of no change means the FOMC has voted to hold rates steady at every meeting during that period, roughly 8 scheduled votes. Each hold is a deliberate policy decision, not a default.
Why the Prime Rate Matters to Everyday Consumers
Unlike the federal funds rate, which is an interbank overnight lending rate, the prime rate has direct consumer-facing consequences. Credit card issuers, HELOC lenders, and variable-rate loan providers all use the prime rate as their floor. Most credit cards are priced at prime plus a margin of 12–16 percentage points.
That means at a prime rate of 7.50%, a consumer with average credit might carry a card APR of 21–23%. This is not theoretical, it’s the lived reality for tens of millions of Americans carrying revolving balances. Understanding how the prime rate affects your credit card interest rates is the first step in making informed borrowing decisions during a flat rate environment.
The prime rate has been changed fewer than 40 times since 2000. Each change, up or down, carries enormous ripple effects across trillions of dollars in consumer and business debt.
The Mechanics of a Rate Hold
Holding rates is not the same as declaring the economy healthy. A hold can reflect caution, data uncertainty, or a deliberate “wait and see” posture. What it signals, broadly, is that current monetary conditions are considered appropriate for the moment.
The FOMC communicates its reasoning through post-meeting statements and the quarterly Summary of Economic Projections (the “dot plot”). Reading this language carefully is how analysts decode what comes next.
Historical Flat Rate Periods: What the Data Shows
Twelve months without a rate change is not unprecedented, but it is uncommon. Looking back at Federal Reserve history reveals clear patterns in what tends to follow extended pauses.
Comparing Past Rate Freeze Periods
| Period | Duration of Flat Rate | Prime Rate Level | What Followed |
|---|---|---|---|
| 2006–2007 | 12 months | 8.25% | Rate cuts beginning Sept 2007 |
| 2018–2019 | 9 months | 5.50% | Three cuts in late 2019 |
| 2011–2015 | 48+ months | 3.25% | First hike in Dec 2015 |
| 1995–1999 | 18 months | 8.50% | Modest hikes in 1999–2000 |
| 2024–2025 | 12+ months | 7.50% | TBD, markets pricing in 2 cuts in 2026 |
Of the four most comparable historical flat-rate periods above 5%, three were followed by rate cuts within 18 months. The outlier, the post-2008 period, was a uniquely prolonged zero-rate environment driven by financial crisis recovery.
What History Teaches Us About Rate Transitions
The pattern is fairly consistent: extended pauses at elevated rates tend to precede easing cycles, not further tightening. Once the Fed has successfully anchored inflation near its target, it typically begins returning rates toward a more “neutral” level, estimated by most Fed officials at around 2.5–3.0% for the federal funds rate.
That puts the prime rate’s neutral zone at roughly 5.50% to 6.00%. A drop from 7.50% to that range would represent 150–200 basis points of cuts, significant relief for borrowers, but a meaningful headwind for savers. Both sides of that tradeoff deserve attention.
In 4 of the last 5 extended flat-rate periods lasting 9+ months, the Fed moved to a rate-cutting cycle within 18 months of the final hold. The average first cut came 11 months after the last rate increase.

What the Fed’s Inaction Is Really Telling You
Central bank inaction is itself a form of communication. Every hold vote is paired with public statements, press conferences, and economic projections that collectively paint a picture of where policymakers believe the economy stands.
Decoding FOMC Language
Fed Chair Jerome Powell has repeatedly used phrases like “data-dependent,” “appropriate firming,” and “higher for longer” in recent communications. These are not accidental word choices. “Data-dependent” signals that no predetermined path exists, the Fed will move when the numbers justify it.
“Higher for longer” dominated 2023 and 2024, signaling that the Fed was not going to rush cuts even as inflation cooled. By 2025, this language began softening, replaced by more balanced language about “risks on both sides” of the dual mandate.
The Bureau of Labor Statistics publishes inflation and employment data that feed directly into each FOMC decision. According to Fed Governor communications and post-meeting statements through early 2026, policymakers have described the current stance as “moderately restrictive”, language that historically precedes a gradual easing cycle rather than sustained holds or hikes. That framing matters more than any single data release.
The Dual Mandate Balancing Act
The Fed operates under a dual mandate: maximum employment and price stability. Rates staying flat signals that both objectives are in reasonable alignment. Inflation has cooled significantly from its 9.1% peak in June 2022. The unemployment rate has remained near 4.0–4.2%, historically low by any measure.
When both mandates are relatively satisfied, the Fed has less incentive to move in either direction. This is the equilibrium state, and it’s precisely what a 12-month flat prime rate reflects.
The Role of Forward Guidance
Beyond the rate itself, the Fed’s forward guidance shapes market expectations. The CME FedWatch Tool, which tracks futures market probabilities, has shown markets pricing in 1–2 rate cuts for 2026 at various points throughout the flat period. This forward pricing affects mortgage rates, bond yields, and long-term CD rates even before a single cut occurs.
The Inflation Connection: Why Stability Matters
The 12-month flat rate period is, at its core, a story about inflation. The Fed raised rates aggressively from March 2022 through mid-2023, lifting the prime rate from 3.25% to 8.50%, specifically to crush inflation. Rates have been flat since then because the medicine appears to be working.
Core PCE: The Fed’s Preferred Measure
The Fed’s preferred inflation gauge is Core PCE (Personal Consumption Expenditures), which strips out volatile food and energy prices. Core PCE peaked at 5.6% in February 2022 and has since fallen to approximately 2.6–2.8% as of late 2025, according to Bureau of Economic Analysis data. That’s meaningfully closer to the 2% target, but not quite there.
Getting from 2.6% to 2.0% is historically the hardest stretch. Services inflation, particularly shelter costs and wages, tends to be sticky. The flat prime rate reflects the Fed waiting for this final stretch to play out, and there’s no guarantee it resolves quickly.
The Fed’s 2% inflation target was formally adopted in January 2012. Before that, price stability was understood but not explicitly quantified. The target itself has been criticized by some economists who argue 3% would allow more flexibility during downturns.
Inflation’s Uneven Impact on Consumers
Even with headline inflation cooling, many consumers don’t feel relief because prices don’t fall, they just rise more slowly. The cumulative price level increase from 2020 to 2025 exceeds 20% for many categories. Groceries, rent, and insurance remain substantially higher than pre-pandemic levels.
This gap between statistical stabilization and lived consumer experience is why a flat prime rate doesn’t immediately translate into consumer confidence. It’s also why the Fed is cautious about cutting too soon, reigniting inflation from a still-elevated base would be politically and economically damaging.
| Inflation Measure | Peak (2022) | Late 2025 | Fed Target |
|---|---|---|---|
| CPI (All Items) | 9.1% | ~2.7% | ~2.0% |
| Core CPI | 6.6% | ~3.2% | ~2.0% |
| Core PCE | 5.6% | ~2.6% | 2.0% |
| Shelter Inflation | 8.2% | ~4.5% | ~2.5% |
How a Flat Prime Rate Affects Borrowers
For borrowers, the flat rate means predictability, but not relief. Variable-rate debt payments have not gotten worse over the past 12 months. But they haven’t improved either. After a year of prime at 7.50%, even “stable” is expensive.
Credit Cards: Still a High-Cost Burden
The average credit card APR hit 22.76% in late 2024, according to Federal Reserve data. At a 7.50% prime rate, this reflects a margin of roughly 15 percentage points above prime, near historical highs for margin spreads. Rates stay elevated for the full duration of the hold period.
For a household carrying $6,000 in credit card debt at 22%, monthly interest charges alone run approximately $110. Over 12 months of a flat rate, that’s over $1,300 in interest, with zero progress on principal unless you’re paying more than the minimum. Understanding how to pay off credit card debt strategically is more important than ever during this kind of environment.
A flat prime rate can create a false sense of security. Your variable-rate debt isn’t getting cheaper, it’s just not getting more expensive. When the Fed begins cutting rates in 2026, your HELOC and card rates will adjust down, but credit card issuers can be slow to pass along reductions.
HELOCs and Variable-Rate Loans
Home equity lines of credit are directly tied to the prime rate, most are priced at prime plus 0–1%. At 7.50% prime, a HELOC might carry a rate of 7.75–8.50%. On a $50,000 balance, that’s roughly $325–$354 per month in interest-only payments.
Homeowners who took out HELOCs during the lower-rate era now face higher carrying costs with no near-term improvement in sight. Before tapping home equity, review how the prime rate affects your mortgage and home equity loan before committing to a variable-rate product.
Personal Loans: Fixed vs. Variable
Most personal loans are fixed-rate products, meaning a flat prime rate doesn’t directly change existing loan payments. New personal loan originations are still priced relative to the current rate environment, however. Borrowers taking out new loans today are doing so at some of the highest fixed rates in 15 years.
The impact of the prime rate on personal borrowing is detailed further in our analysis of how the prime rate affects personal loan rates and what to do about it.
What Savers and Investors Should Know
Bad news for borrowers carrying debt doesn’t tell the whole story. For savers, the elevated flat rate period has been a genuine gift, particularly for those who positioned themselves in high-yield accounts and certificates of deposit during this window.
High-Yield Savings Accounts
Online high-yield savings accounts have offered APYs of 4.50–5.25% throughout the flat rate period, dramatically higher than the 0.40–0.50% national average at traditional banks. The gap between the two is staggering: a $25,000 savings balance earns roughly $1,125/year at 4.5% APY versus just $100/year at 0.40%.
The window for these rates is closing, though. As markets price in Fed cuts in 2026, high-yield savings rates are beginning to drift downward. Savers who haven’t moved their emergency funds to a competitive account are leaving real money on the table.
A $25,000 balance in a high-yield savings account at 4.75% APY earns $1,187.50 in one year. The same balance at the national average of 0.45% earns just $112.50, a difference of over $1,075 annually.
CDs: The Lock-In Opportunity
Certificates of deposit have been among the biggest beneficiaries of the elevated, flat-rate environment. 12-month CD rates peaked near 5.50% in late 2023 and have held in the 4.50–5.00% range through much of the flat period. For investors willing to lock in for 12–24 months, this represents a risk-free return that rivals many dividend stocks.
The strategic play here is a CD ladder, staggering maturity dates across multiple CDs to balance yield and liquidity. As rates begin to fall, locking in today’s rates for 2–3 years becomes increasingly attractive. Our CD rates forecast for 2026 breaks down what to expect as the rate cycle potentially turns.
If you expect the Fed to begin cutting rates in late 2026, consider locking in a 2-year CD now at 4.50–4.75% APY. Even a 1% rate cut would reduce new CD offerings significantly, making today’s rates look attractive in hindsight.
Bond Markets and Investment Implications
Rate stability creates a predictable environment for fixed-income investors. When cuts are expected in the medium term, longer-duration bonds become more attractive, their fixed payments become more valuable as yields decline.
Equity markets also tend to perform reasonably well during Fed pause periods, as financing costs for corporations stabilize and the outlook for consumer spending becomes more predictable. The S&P 500 has historically delivered positive returns during extended rate holds, averaging approximately 8–12% annually.
One honest caveat: these historical averages mask significant variation. The 2006–2007 flat period, for example, preceded the financial crisis, strong equity performance during the hold gave way sharply once cuts began and recession followed. Past pattern matching is useful context, not a guarantee.

Effects on the Housing Market
The housing market has one of the most complex relationships with the prime rate. Mortgage rates are primarily tied to the 10-year Treasury yield, not directly to the prime rate. However, HELOCs, adjustable-rate mortgages (ARMs), and construction loans are directly prime-linked.
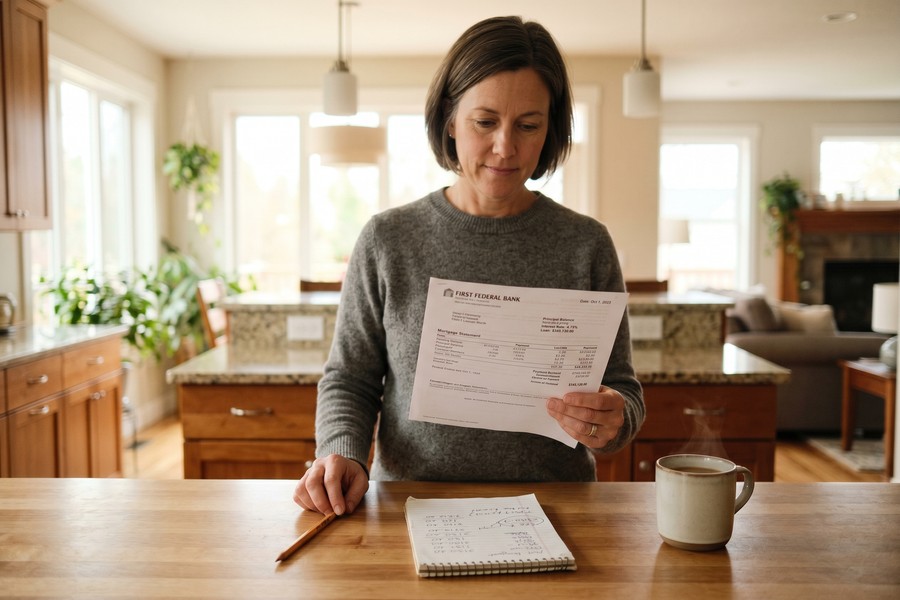
Mortgage Rates During the Flat Period
While the prime rate has been flat, 30-year fixed mortgage rates have fluctuated between 6.5% and 7.5%, driven largely by Treasury market dynamics and inflation expectations. This has kept housing affordability near multi-decade lows, with the mortgage payment-to-income ratio for a median-priced home exceeding 35% in many major markets.
This affordability crunch has frozen the housing market in many ways. Existing homeowners with 3% mortgages are reluctant to sell and “trade up” into a 7% mortgage. New construction has picked up somewhat, but not enough to meaningfully ease supply constraints.
What a Flat Rate Means for Homebuyers and Sellers
| Buyer/Seller Type | Impact of Flat Prime Rate | Strategic Consideration |
|---|---|---|
| First-Time Buyer | Affordability remains constrained | Consider ARM products, build savings for larger down payment |
| HELOC Borrower | Rate stable, not improving | Consider converting to fixed-rate HELOAN if cutting starts |
| Existing Homeowner | “Lock-in effect” continues | Refinancing not yet advantageous, wait for 150+ bps of cuts |
| Real Estate Investor | Cap rates recovering slowly | Monitor forward curve for rate cut timing signals |
The flat prime rate environment has reinforced the “lock-in effect” that has defined the post-pandemic housing market. Homeowners who refinanced at 2.5–3.5% between 2020 and 2022 have no incentive to sell, dramatically reducing inventory.
According to Redfin, approximately 85% of U.S. homeowners with mortgages have a rate below 6%. This “golden handcuff” effect has reduced housing turnover to some of the lowest levels in decades, keeping supply tight despite slower demand.
What It Signals for Business Lending and the Job Market
Small businesses rely heavily on prime-linked credit facilities, including lines of credit, equipment loans, and SBA-backed products. After 12 months of a flat rate at 7.50%, business borrowing costs have stabilized but remain elevated relative to 2018–2021 norms.
Small Business Credit Conditions
Small business loan rates, typically prime plus 2–4%, have sat in the 9.50–11.50% range during the flat period. For a small business borrowing $250,000 to fund operations or expansion, that’s $23,750–$28,750 in annual interest. This is a meaningful cost burden compared to the 5–7% rates available just four years ago.
The NFIB Small Business Economic Trends survey has consistently shown that “cost of borrowing” ranks among top concerns for small business owners. During the flat rate period, this concern has remained elevated even though rates haven’t moved higher.
Labor Market Implications
A flat prime rate that reflects a soft-landing scenario, inflation controlled, employment intact, is the most favorable outcome for the labor market. The unemployment rate near 4.0–4.2% is consistent with full employment under most modern economic frameworks.
According to Federal Reserve post-meeting statements through early 2026, policymakers have characterized labor market conditions as “broadly in balance,” with wage growth moderating toward levels consistent with 2% inflation over time. That framing suggests the Fed sees no urgent reason to cut for employment reasons, cuts, when they come, will be driven by inflation progress rather than job market distress.
Should the flat prime rate signal precede cuts, the labor market could get a further boost, cheaper business credit means more hiring, expansion, and capital investment. This is the “soft landing plus easing” scenario that many economists consider optimal.
What Comes Next: Reading the Forward Signals
Understanding the flat prime rate signal is only useful if you can also read what comes next. Markets, Fed communications, and economic data collectively point toward a transition, but timing and magnitude are far from certain.
Market Pricing and the Fed Dot Plot
As of early 2026, futures markets have been pricing in 1–2 rate cuts of 25 basis points each by year-end. The Fed’s dot plot, released quarterly, shows a similar median expectation among FOMC members. A 50 basis-point total reduction would bring the prime rate to 7.00%.
That’s still high by historical standards. The pre-pandemic prime rate was 4.75%. Getting back to that level, if it ever happens, would require 11 more cuts of 25 basis points each, a multi-year journey.
Key Economic Triggers to Watch
| Indicator | Current Level | Level That May Trigger a Cut | Level That May Trigger a Hike |
|---|---|---|---|
| Core PCE Inflation | ~2.6% | Below 2.2% for 2+ months | Above 3.5% sustained |
| Unemployment Rate | ~4.1% | Above 4.5% for 2+ months | Below 3.5% with wage pressure |
| GDP Growth | ~2.1% | Below 1.0% for two quarters | Above 3.5% with inflation |
| Wage Growth (YoY) | ~3.8% | Below 3.0% | Above 5.0% sustained |
According to Federal Reserve Bank of Cleveland inflation nowcasting data and the New York Fed’s r-star estimates, the current policy rate remains meaningfully above neutral. The Fed’s own communications through early 2026 describe policy as “restrictive”, an implicit acknowledgment that cuts are the directional next step, not hikes. The question is timing, not direction.
What a Rate Cut Would Mean in Practice
A 25-basis-point cut to 7.25% prime would reduce HELOC payments by approximately $10.42 per month per $50,000 balance. A full 100-basis-point cut (four quarter-point moves) would save $41.67 per month on that same balance. Credit card APRs would eventually follow, though often with a lag of 1–2 billing cycles.
For savers, each cut erodes the yields on high-yield savings accounts and new CD offerings. This is why the current flat-rate window, however long it lasts, represents a genuine opportunity to lock in strong fixed returns before the environment shifts.
Don’t assume rate cuts will happen on a fixed schedule. In 2019, the Fed cut three times and then stopped. In 2024, it cut twice and paused. The pace and depth of any future easing cycle is impossible to predict with certainty, plan for multiple scenarios.
Real-World Example: How Maria Used a Flat Rate Period to Transform Her Finances
Maria is a 38-year-old marketing manager in Austin, Texas. In January 2024, she was carrying $8,400 in credit card debt at 22.5% APR, had $12,000 sitting in a traditional savings account earning 0.35% APY, and was considering a HELOC to fund a $25,000 kitchen renovation on her home purchased in 2020 at 3.1% mortgage rate.
Recognizing the flat prime rate signal as a window of opportunity, Maria took three strategic steps over the course of 12 months. First, she moved her $12,000 savings to a high-yield account offering 4.85% APY, earning $582 annually instead of $42, a gain of $540 per year. Second, she used the debt avalanche method to aggressively pay down her credit card, directing $800/month toward her highest-rate balance. By month 12, her card debt was fully eliminated, saving her approximately $1,890 in interest she would have paid at 22.5% APR.
For her renovation, she chose a fixed-rate home improvement loan at 8.75% rather than a variable HELOC at 8.25%, correctly anticipating that any future prime rate cuts would not arrive in time to make the variable option meaningfully cheaper. She locked in cost certainty over a 5-year repayment term, budgeting exactly $519/month.
By December 2025, Maria had eliminated $8,400 in high-interest debt, earned $582 in savings interest she previously left on the table, and avoided the payment volatility of a variable-rate renovation loan. The total financial benefit compared to her January 2024 path: approximately $4,200 in reduced interest costs and increased savings yield over 12 months, all by understanding and acting on the flat prime rate signal at the right time.
Your Action Plan
-
Audit all your variable-rate debt immediately
List every debt tied to the prime rate: HELOCs, credit cards, variable personal loans. Note the current rate, outstanding balance, and monthly interest cost. This baseline tells you exactly how much you’re paying for the current rate environment, and what you stand to gain or lose if rates move.
-
Move idle savings to a high-yield account
Any emergency fund or short-term savings sitting in a traditional bank account earning under 1% APY should be moved immediately. Top high-yield savings accounts in 2026 are offering 4.50–5.00% APY. On $20,000, that’s a difference of $700–$900 per year, risk-free.
-
Lock in CD rates before cuts arrive
Cash you won’t need for 12–24 months belongs in a CD at today’s rates. The best CD rates in 2026 are still competitive. A 24-month CD at 4.50% guarantees that return regardless of what the Fed does to the prime rate over that period.
-
Accelerate payoff of high-interest variable debt
With credit card rates near 22% and no relief in sight for the near term, every extra dollar directed toward principal saves you more than almost any investment can earn. Use the debt avalanche method, targeting the highest-rate balance first, to minimize total interest paid.
-
Maximize tax-advantaged retirement contributions
A flat rate period with stable markets is an ideal time to max out your retirement accounts. For 2026, the 401(k) contribution limit is $23,500 (plus a $7,500 catch-up if you’re 50+). Review our guide to 401(k) contribution limits for 2026 and confirm you’re contributing at least enough to capture your full employer match.
-
Build or top off your emergency fund
Financial stability starts with 3–6 months of living expenses in liquid savings. During a flat rate period when high-yield accounts pay 4.5%+, your emergency fund is actually working for you. Target a minimum of $10,000–$20,000 depending on your monthly expenses and job security.
-
Monitor the Fed’s dot plot and economic releases
Subscribe to FOMC meeting calendar alerts. After each meeting, read the official statement and press conference summary. Pay particular attention to changes in language around inflation confidence, labor market conditions, and the neutral rate. This is your early warning system for when the flat rate period ends.
-
Reassess your fixed vs. variable debt strategy as cuts approach
Rate cuts shift the calculus on new borrowing. Variable-rate products become more attractive relative to fixed when cuts are underway. Consider timing any new borrowing, whether a HELOC or personal loan, to coincide with a lower-rate environment. Conversely, an ARM mortgage coming up for adjustment requires advance planning for the new payment scenarios.
Frequently Asked Questions
What exactly does a “flat prime rate” mean?
A flat prime rate means the Federal Reserve has held its federal funds rate target steady for an extended period, in this case, 12+ months, resulting in no change to the prime rate, which is set at the federal funds rate plus 3 percentage points. It signals that the Fed believes current monetary policy is appropriately calibrated for economic conditions.
Is a flat prime rate good or bad for consumers?
It depends entirely on your financial position. For borrowers with variable-rate debt, it’s neutral, rates aren’t rising, but they’re not falling either. For savers, a flat rate at elevated levels (7.50%) is positive, as it maintains high yields on savings accounts and CDs. The flat prime rate signal is good news for those who have taken advantage of high-yield savings and bad news for those still carrying expensive variable debt.
How does a 12-month flat prime rate differ from a longer freeze?
Duration matters significantly in interpreting central bank behavior. A 12-month hold at an elevated rate strongly suggests the Fed is in a “wait and see” mode, they believe rates are restrictive enough to contain inflation, but they’re not yet confident enough to ease. A much longer hold, like the 48-month freeze from 2011–2015, typically reflects a different dynamic, a prolonged recovery from crisis conditions where rates were at emergency lows.
Will credit card rates drop when the prime rate is cut?
Yes, but with a lag. Credit card issuers are required to notify cardholders of APR changes, and adjustments typically take 1–2 billing cycles to appear after a prime rate cut. Also, the pass-through is not always one-for-one, issuers may not pass along the full reduction, particularly to customers they view as higher risk. Watch your statements carefully after any Fed cut.
How does the flat prime rate signal affect my mortgage?
Fixed-rate mortgage holders see no direct impact on their payments. Borrowers with an adjustable-rate mortgage (ARM) or a HELOC will see their rate adjustments remain stable during a flat period. When cuts begin, ARM and HELOC rates will decrease at your next adjustment date.
Should I refinance my mortgage during a flat rate period?
Generally, no, not yet. Refinancing into a rate similar to your current one saves little after closing costs. The conventional wisdom is that refinancing makes sense when you can reduce your rate by at least 0.75–1.0 percentage points. Should the Fed begin cutting rates significantly, a refinancing opportunity may emerge in 2027 or beyond for those with current rates above 6.5%.
What is the “neutral rate” and why does it matter?
The neutral rate (sometimes called r-star) is the theoretical federal funds rate that neither stimulates nor restricts economic growth. Most Fed officials estimate it at 2.5–3.0% for the federal funds rate, implying a prime rate of 5.50–6.00%. The current prime rate of 7.50% is approximately 150–200 basis points above neutral, meaning monetary policy is still considered restrictive, even after 12 months of no changes.
How should I invest during a flat prime rate environment?
A flat, elevated rate environment favors fixed-income investments (CDs, Treasury bills, money market funds), dividend-paying stocks with stable cash flows, and index funds for long-term growth. It’s less favorable for growth stocks and real estate investment trusts (REITs), which are sensitive to rate expectations. Diversification across asset classes remains the most prudent approach regardless of rate environment.
What happens to my money market account during a flat rate period?
Money market account yields are closely tied to the prime rate and prevailing short-term interest rates. During the flat period, money market rates have held near 4.5–5.0% at competitive online institutions. These rates will decline when the Fed begins cutting. For current options, see our rankings of the best money market accounts available today.
Is the economy in good shape when the prime rate is flat for 12 months?
A 12-month flat prime rate at elevated levels suggests the economy is in a state of managed deceleration, inflation has largely been tamed, employment remains healthy, but growth may be softening. It’s not a “boom” signal, but it’s also not a recession indicator in isolation. The flat prime rate signal must be read alongside GDP data, consumer spending trends, and labor market conditions for a complete picture.
Why don’t rate cuts immediately lower what I owe on variable debt?
Rate cuts reduce your ongoing interest charges from the adjustment date forward, they do not reduce your principal balance. On a $10,000 credit card balance, a 0.25% rate cut saves roughly $25 per year in interest, not a lump-sum reduction in what you owe. The only way to meaningfully reduce total debt cost is to pay down principal faster, regardless of where rates go.
Could the prime rate go higher from here instead of lower?
Yes, though markets currently view that as unlikely. The primary scenario that would force the Fed back to hiking is a sustained re-acceleration of inflation, core PCE climbing back above 3.5% for multiple months, or wage growth spiking above 5% with no sign of easing. Neither condition is currently present, but the 2021–2022 experience shows how quickly the picture can change. Holding some variable-rate debt at fixed terms is a reasonable hedge against that scenario.
The U.S. economy has experienced only 7 periods of 12+ consecutive months with a flat prime rate since 1971. In 5 of those 7 cases, GDP growth averaged above 2.0% during the hold, consistent with a soft-landing or stable growth scenario.
Sources
- Federal Reserve, Consumer Credit Outstanding (G.19 Statistical Release)
- Federal Reserve, Federal Open Market Committee Meeting Information
- Federal Reserve, Average Credit Card Interest Rates (G.19)
- Bureau of Economic Analysis, Personal Consumption Expenditures Price Index
- NFIB, Small Business Economic Trends Survey
- Bureau of Labor Statistics, Consumer Price Index News Release
- Bureau of Labor Statistics, Employment Situation Summary
- Federal Reserve, FOMC Meeting Minutes (January 2025)
- Federal Reserve Bank of Cleveland, Inflation Nowcasting
- Federal Reserve Bank of New York, Measuring the Natural Rate of Interest (r-star)
- Federal Reserve Bank of St. Louis (FRED), Bank Prime Loan Rate Historical Data
- FDIC, National Rates and Rate Caps for Deposit Accounts
- Bureau of Economic Analysis, Gross Domestic Product Data