Fact-checked by the Prime Rate editorial team
Quick Answer
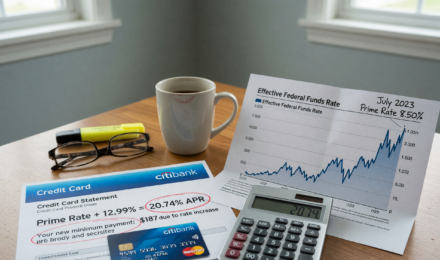
The U.S. prime rate has ranged from a historic low of 3.25% (held from 2008 to 2015 and again in 2020–2022) to an all-time high of 21.5% in December 1980. As of July 2025, the prime rate stands at 7.50%, set by major U.S. banks in response to Federal Reserve policy decisions.
Reviewed year by year, prime rate history is a direct record of how U.S. banks have priced credit for their most creditworthy customers, tracking almost in lockstep with the Federal Reserve’s federal funds rate. According to Federal Reserve Statistical Release H.15, the prime rate is typically set at the federal funds target rate plus 3 percentage points. Understanding this history helps consumers, investors, and borrowers anticipate how monetary policy shapes borrowing costs.
Whether you’re tracking the cost of a home equity line, a credit card’s variable APR, or a small business loan, this benchmark drives them all. This guide covers the complete prime rate history by year, explains the forces behind major rate shifts, and shows what each era means for your financial decisions today.
Key Takeaways
- The prime rate reached its all-time high of 21.5% in December 1980, driven by the Federal Reserve’s aggressive inflation-fighting campaign under Chairman Paul Volcker (Federal Reserve History).
- A historic floor of 3.25% was hit twice: first from December 2008 through December 2015, and again from March 2020 through March 2022, in response to financial crises (Federal Reserve H.15 Data).
- As of July 2025, the prime rate is 7.50%, reflecting the Fed’s cumulative rate hikes of 525 basis points between March 2022 and July 2023 (Wall Street Journal Money Rates).
- More than 600 changes have occurred since the Federal Reserve began publishing the prime rate systematically in the 1950s, reflecting decades of shifting monetary policy (Federal Reserve H.15).
- A 1 percentage point increase in the prime rate translates directly to higher variable-rate debt costs, affecting an estimated $1 trillion+ in U.S. consumer credit card balances (Consumer Financial Protection Bureau).
In This Guide
- What Is the Prime Rate and How Is It Set?
- What Does the Complete Prime Rate History by Year Show?
- What Caused the Historic High Rates of the 1970s and 1980s?
- How Has the Prime Rate Changed in the Modern Era (2000–Present)?
- How Does Prime Rate History Affect Your Borrowing Costs?
- What Is the Prime Rate Outlook for 2025 and Beyond?
- Frequently Asked Questions
What Is the Prime Rate and How Is It Set?
Banks use the prime rate as the benchmark interest rate they charge their most creditworthy corporate customers. It is not set by the government. It is a market rate established by individual banks, but it moves in near-perfect alignment with the federal funds rate set by the Federal Open Market Committee (FOMC).
The Prime Rate Formula
The standard formula is straightforward: prime rate = federal funds target rate + 3%. This relationship has held consistently since the early 1990s, as documented by the Federal Reserve’s H.15 statistical release. When the FOMC raises or lowers the federal funds rate, banks adjust the prime rate almost immediately.
The Wall Street Journal publishes the most widely referenced prime rate, calculated when at least 23 of the 30 largest U.S. banks change their base rate. This published rate is the benchmark used in most consumer loan agreements.
The prime rate and the federal funds rate have moved in perfect parallel since 1994. Every single FOMC rate decision since then has resulted in a matching prime rate adjustment by major U.S. banks, always maintaining the 3-percentage-point spread.
What Does the Complete Prime Rate History by Year Show?
Five distinct eras emerge when you review this data year by year: the pre-modern period before 1970, the inflationary surge of the 1970s, the Volcker peak of the early 1980s, the long decline through the 1990s and 2000s, and the near-zero era followed by the 2022–2023 tightening cycle. The table below captures the prime rate at the close of each decade and at key turning-point years.
| Year | Prime Rate (Year-End or Peak) | Key Driver |
|---|---|---|
| 1960 | 4.50% | Post-war economic expansion |
| 1969 | 8.50% | Vietnam-era inflation pressure |
| 1974 | 12.00% | OPEC oil embargo, stagflation |
| 1980 | 21.50% | Volcker anti-inflation campaign |
| 1990 | 10.00% | Recession, S&L crisis |
| 2000 | 9.50% | Dot-com boom peak |
| 2007 | 7.25% | Pre-financial crisis high |
| 2008 | 3.25% | Global Financial Crisis response |
| 2015 | 3.50% | First post-crisis Fed hike |
| 2019 | 4.75% | End of tightening cycle |
| 2020 | 3.25% | COVID-19 emergency cuts |
| 2023 | 8.50% | Peak of post-COVID tightening |
| 2025 (July) | 7.50% | Fed rate-cut cycle in progress |
Where to Find Official Historical Data
The most authoritative source for prime rate history by year is the Federal Reserve’s H.15 Selected Interest Rates release, which publishes daily, weekly, and monthly prime rate data going back decades. The FDIC and the St. Louis Federal Reserve (FRED) also maintain historical series used by researchers and financial professionals.

What Caused the Historic High Rates of the 1970s and 1980s?
Reaching 21.5% in December 1980, its all-time record, the prime rate spiked because the Federal Reserve under Chairman Paul Volcker deliberately engineered a severe credit crunch to break the back of double-digit inflation. This remains the most dramatic episode in the full historical record.
The Volcker Shock Explained
From 1979 to 1981, the Fed shifted to targeting money supply growth rather than interest rate levels. This caused short-term rates to spike unpredictably. According to Federal Reserve History’s account of Volcker’s anti-inflation measures, the federal funds rate briefly exceeded 20% in mid-1981, pulling the prime rate to its historic ceiling.
The strategy worked. Inflation fell from 14.8% in March 1980 to 3.2% by 1983, according to Bureau of Labor Statistics CPI historical data. The cost was a deep recession in 1981–1982, with unemployment peaking above 10%. That trade-off, wringing out inflation at the price of a severe contraction, is worth keeping in mind whenever the Fed debates how aggressively to tighten today.
Once inflationary expectations became unanchored, restoring price stability required the blunt instrument of very high interest rates. There was no painless path. The account is detailed in Federal Reserve History’s essay on anti-inflation measures.
The 1974 and 1979 Oil Shock Episodes
Two OPEC oil embargoes, in 1973 and 1979, triggered inflationary spikes that pushed the prime rate well above 10% on both occasions. The 1974 peak reached 12%, and the 1979–1980 surge drove the rate to its all-time high. These events illustrate how external supply shocks can force rapid, painful monetary tightening, and how little control borrowers have over that process.
The prime rate exceeded 10% for a continuous stretch of more than 12 years, from August 1973 through April 1985, the longest sustained period of double-digit prime rates in U.S. history.
How Has the Prime Rate Changed in the Modern Era (2000–Present)?
From 2000 onward, this history is defined by two prolonged near-zero periods and one aggressive tightening cycle. The Fed’s response to the dot-com bust, the 2008 Global Financial Crisis, and the 2020 COVID-19 pandemic each brought rates to generational lows, while the 2022–2023 tightening cycle was the fastest in four decades.
The 2008 Global Financial Crisis Response
Cutting the federal funds rate to a target range of 0%–0.25% in December 2008, the Federal Reserve dropped the prime rate to 3.25%. It held that level for seven years, the longest stretch at any single rate level in modern history. As reported by the St. Louis Fed’s Regional Economist, the first post-crisis rate hike didn’t occur until December 2015.
The COVID-19 Emergency Cuts and 2022 Reversal
In March 2020, the FOMC made two emergency cuts within two weeks, slashing the prime rate back to 3.25%. Starting in March 2022, the Fed executed the fastest tightening cycle since Volcker, raising rates by 525 basis points in 16 months. By July 2023, the prime rate had reached 8.50%, its highest level since January 2001, according to FRED’s daily prime rate series.
Rate cuts began in September 2024. By July 2025, the rate stands at 7.50%, reflecting three quarter-point reductions. For a full explanation of how these shifts affect everything from credit card rates to HELOCs, see our guide on what happens to your savings when the prime rate rises.
The 525 basis points of tightening between March 2022 and July 2023 was the fastest pace of Fed rate increases since the early 1980s Volcker era. No tightening cycle in the intervening four decades came close in speed or magnitude.

How Does Prime Rate History Affect Your Borrowing Costs?
Every major category of consumer and business credit is anchored to this benchmark. Even small shifts, like the 25 basis point moves common in recent FOMC cycles, translate into real dollar changes on variable-rate debt. That effect compounds quickly across large balances.
Credit Cards, HELOCs, and Personal Loans
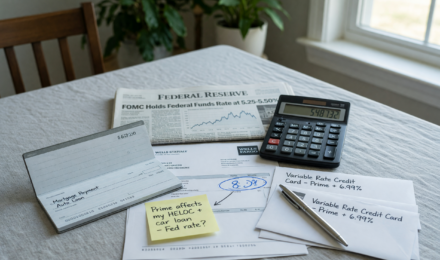
Variable-rate credit cards are typically priced at prime plus a fixed margin. When the rate rose from 3.25% to 8.50% between early 2022 and mid-2023, average credit card APRs climbed to record highs above 20%, according to Federal Reserve G.19 consumer credit data. For a detailed breakdown, see our explainer on how the prime rate affects your credit card interest rates.
Home equity lines of credit (HELOCs) are also directly tied to the prime rate. Homeowners who took out HELOCs at 3.25% in 2021 found their payments nearly triple by late 2023. Our guide on how the prime rate affects your mortgage and home equity loan covers this dynamic in full detail.
Small Business and Personal Loan Implications
The Small Business Administration (SBA) ties many of its loan programs directly to the prime rate. A rise from 3.25% to 8.50% adds more than $2,600 per year in interest costs on a typical $50,000 variable-rate business line of credit. For consumers carrying personal loans, our article on how the prime rate affects personal loan rates breaks down the practical impact.
When the prime rate is rising, prioritize paying down variable-rate debt, especially credit cards and HELOCs, before putting extra cash into low-yield savings. Once rates begin falling, locking in a fixed-rate product like a CD can capture current yields before they drop. Compare options in our best CD rates guide.
What Is the Prime Rate Outlook for 2025 and Beyond?
The Fed’s dot plot and market pricing suggest a continued, gradual rate-cut trajectory. Currently at 7.50%, futures markets tracked by the CME Group’s FedWatch Tool are pricing in an additional one to two quarter-point cuts before year-end 2025.
What Lower Rates Mean for Consumers
A falling prime rate reduces the cost of variable-rate debt. Borrowers with outstanding HELOCs, adjustable-rate mortgages, and credit card balances will see incremental payment relief with each Fed cut. Savers holding high-yield savings accounts and money market accounts, on the other hand, will see yields compress. That makes it worth exploring whether CDs or high-yield savings accounts earn you more in the current environment.
Key Risks to the Outlook
Any resurgence in inflation, driven by energy prices, labor costs, or geopolitical disruption, could halt or reverse the current easing cycle. The Fed has repeatedly signaled it will not cut rates if inflation moves above its 2% target on a sustained basis, per FOMC policy statements.
History offers a consistent lesson here: rates can stay higher for longer than markets expect, and can fall faster than anyone anticipates. The 2022–2023 cycle is just the latest proof. Consumers should plan for rate volatility rather than assume a straight-line decline.
Frequently Asked Questions
What is the current U.S. prime rate?
As of July 2025, the U.S. prime rate is 7.50%. It reflects the Federal Reserve’s current federal funds target range of 4.25%–4.50% plus the standard 3-point spread. The rate is updated immediately following any FOMC policy decision.
What was the highest prime rate in U.S. history?
The all-time high was 21.5%, reached in December 1980. This peak resulted from the Federal Reserve’s aggressive monetary tightening under Chairman Paul Volcker, designed to break entrenched double-digit inflation. The rate had fallen to 11.5% by the end of 1982.
What was the lowest prime rate in U.S. history?
The record low is 3.25%, reached twice: from December 2008 to December 2015 following the Global Financial Crisis, and again from March 2020 to March 2022 following the COVID-19 emergency rate cuts. Both instances reflected the Fed’s zero-interest-rate policy (ZIRP).
How often does the prime rate change?
The prime rate changes whenever the Federal Reserve adjusts the federal funds rate. The FOMC meets eight times per year, though it can call emergency meetings. Between 2022 and 2023, the Fed raised rates at 11 consecutive meetings, making that one of the most active rate-change periods in recent history.
How does the prime rate affect mortgage rates?
Adjustable-rate mortgages (ARMs) and home equity lines of credit (HELOCs) are directly tied to the prime rate. Fixed-rate mortgages are more influenced by 10-year Treasury yields than by the prime rate directly. That said, rising prime rates typically signal a tighter credit environment that pushes all mortgage rates higher.
Where can I find a full prime rate history by year?
The most authoritative source is the St. Louis Federal Reserve’s FRED database, which provides daily prime rate data going back to 1955. The Federal Reserve’s H.15 release also provides monthly and annual averages. Both are free and publicly accessible.
Is the prime rate the same as the federal funds rate?
No, they are different rates, but they are closely linked. The federal funds rate is the rate banks charge each other for overnight lending and is set by the FOMC. The prime rate is what banks charge their best commercial customers and is always approximately 3 percentage points above the federal funds rate.
Why does the prime rate matter for credit card holders?
Most variable-rate credit cards are priced as prime plus a fixed margin set by the card issuer. When the prime rate rises by 1 percentage point, your card’s APR rises by the same amount, automatically, without any action by you or the bank. On a $10,000 balance, that one-point move costs roughly $100 more per year in interest, assuming you carry the balance month to month.
How quickly does a Fed rate change show up in my loan payments?
For most variable-rate products, the adjustment is nearly immediate. Banks typically update their prime rate the same day the FOMC announces a decision, and credit card and HELOC rates usually reset within one to two billing cycles. Fixed-rate loans are unaffected by subsequent prime rate changes, only new borrowing is priced at the current rate.
Has the prime rate ever stayed flat for years at a time?
Yes, twice in recent history. Following the 2008 financial crisis, the rate sat at 3.25% for seven consecutive years, from December 2008 through December 2015. It returned to 3.25% again from March 2020 through March 2022. Outside of those crisis-driven floors, multi-year stretches of no movement are unusual; rate changes have typically clustered in active tightening or easing cycles.
Sources
- Federal Reserve, H.15 Selected Interest Rates (Historical Data)
- St. Louis Federal Reserve FRED, Bank Prime Loan Rate Daily Series
- Federal Reserve History, Anti-Inflation Measures of the 1980s
- Federal Reserve, G.19 Consumer Credit Statistical Release
- Federal Reserve, FOMC Policy Statements and Meeting Schedules
- U.S. Bureau of Labor Statistics, Consumer Price Index Historical Data
- Wall Street Journal, Money Rates (Prime Rate Reference)
- Consumer Financial Protection Bureau, Consumer Credit Trends